Macedonian vs Subsaharan African Male Poverty

COMPARE

Macedonian
Race
Ancestry
AfghanAfricanAlaska NativeAlaskan AthabascanAlbanianAleutAlsatianAmericanApacheArabArapahoArgentineanArmenianAssyrian/Chaldean/SyriacAustralianAustrianBahamianBangladeshiBarbadianBasqueBelgianBelizeanBermudanBhutaneseBlackfeetBolivianBrazilianBritishBritish West IndianBulgarianBurmeseCajunCambodianCanadianCape VerdeanCarpatho RusynCelticCentral AmericanCentral American IndianCherokeeCheyenneChickasawChileanChineseChippewaChoctawColombianColvilleComancheCosta RicanCreeCreekCroatianCrowCubanCypriotCzechCzechoslovakianDanishDelawareDominicanDutchDutch West IndianEastern EuropeanEcuadorianEgyptianEnglishEstonianEthiopianEuropeanFijianFilipinoFinnishFrenchFrench American IndianFrench CanadianGermanGerman RussianGhanaianGreekGuamanian/ChamorroGuatemalanGuyaneseHaitianHmongHonduranHopiHoumaHungarianIcelanderIndian (Asian)IndonesianInupiatIranianIraqiIrishIroquoisIsraeliItalianJamaicanJapaneseJordanianKenyanKiowaKoreanLaotianLatvianLebaneseLiberianLithuanianLumbeeLuxembourgerMacedonianMalaysianMalteseMarshalleseMenomineeMexicanMexican American IndianMongolianMoroccanNative HawaiianNavajoNepaleseNew ZealanderNicaraguanNigerianNorthern EuropeanNorwegianOkinawanOsageOttawaPaiutePakistaniPalestinianPanamanianParaguayanPennsylvania GermanPeruvianPimaPolishPortuguesePotawatomiPuebloPuerto RicanPuget Sound SalishRomanianRussianSalvadoranSamoanScandinavianScotch-IrishScottishSeminoleSenegaleseSerbianShoshoneSierra LeoneanSiouxSlavicSlovakSloveneSomaliSouth AfricanSouth AmericanSouth American IndianSoviet UnionSpaniardSpanishSpanish AmericanSpanish American IndianSri LankanSudaneseSwedishSwissSyrianTaiwaneseThaiTlingit-HaidaTohono O'OdhamTonganTrinidadian and TobagonianTsimshianTurkishU.S. Virgin IslanderUgandanUkrainianUruguayanUteVenezuelanVietnameseWelshWest IndianYakamaYaquiYugoslavianYumanYup'ikZimbabwean
Immigration
NonimmigrantsImmigrantsAfghanistanAfricaAlbaniaArgentinaArmeniaAsiaAustraliaAustriaBahamasBangladeshBarbadosBelarusBelgiumBelizeBoliviaBosnia and HerzegovinaBrazilBulgariaBurma/MyanmarCabo VerdeCambodiaCameroonCanadaCaribbeanCentral AmericaChileChinaColombiaCongoCosta RicaCroatiaCubaCzechoslovakiaDenmarkDominicaDominican RepublicEastern AfricaEastern AsiaEastern EuropeEcuadorEgyptEl SalvadorEnglandEritreaEthiopiaEuropeFijiFranceGermanyGhanaGreeceGrenadaGuatemalaGuyanaHaitiHondurasHong KongHungaryIndiaIndonesiaIranIraqIrelandIsraelItalyJamaicaJapanJordanKazakhstanKenyaKoreaKuwaitLaosLatin AmericaLatviaLebanonLiberiaLithuaniaMalaysiaMexicoMicronesiaMiddle AfricaMoldovaMoroccoNepalNetherlandsNicaraguaNigeriaNorth AmericaNorth MacedoniaNorthern AfricaNorthern EuropeNorwayOceaniaPakistanPanamaPeruPhilippinesPolandPortugalRomaniaRussiaSaudi ArabiaScotlandSenegalSerbiaSierra LeoneSingaporeSomaliaSouth AfricaSouth AmericaSouth Central AsiaSouth Eastern AsiaSouthern EuropeSpainSri LankaSt. Vincent and the GrenadinesSudanSwedenSwitzerlandSyriaTaiwanThailandTrinidad and TobagoTurkeyUgandaUkraineUruguayUzbekistanVenezuelaVietnamWest IndiesWestern AfricaWestern AsiaWestern EuropeYemenZaireZimbabweAzores
Subsaharan African
Race
Ancestry
AfghanAfricanAlaska NativeAlaskan AthabascanAlbanianAleutAlsatianAmericanApacheArabArapahoArgentineanArmenianAssyrian/Chaldean/SyriacAustralianAustrianBahamianBangladeshiBarbadianBasqueBelgianBelizeanBermudanBhutaneseBlackfeetBolivianBrazilianBritishBritish West IndianBulgarianBurmeseCajunCambodianCanadianCape VerdeanCarpatho RusynCelticCentral AmericanCentral American IndianCherokeeCheyenneChickasawChileanChineseChippewaChoctawColombianColvilleComancheCosta RicanCreeCreekCroatianCrowCubanCypriotCzechCzechoslovakianDanishDelawareDominicanDutchDutch West IndianEastern EuropeanEcuadorianEgyptianEnglishEstonianEthiopianEuropeanFijianFilipinoFinnishFrenchFrench American IndianFrench CanadianGermanGerman RussianGhanaianGreekGuamanian/ChamorroGuatemalanGuyaneseHaitianHmongHonduranHopiHoumaHungarianIcelanderIndian (Asian)IndonesianInupiatIranianIraqiIrishIroquoisIsraeliItalianJamaicanJapaneseJordanianKenyanKiowaKoreanLaotianLatvianLebaneseLiberianLithuanianLumbeeLuxembourgerMalaysianMalteseMarshalleseMenomineeMexicanMexican American IndianMongolianMoroccanNative HawaiianNavajoNepaleseNew ZealanderNicaraguanNigerianNorthern EuropeanNorwegianOkinawanOsageOttawaPaiutePakistaniPalestinianPanamanianParaguayanPennsylvania GermanPeruvianPimaPolishPortuguesePotawatomiPuebloPuerto RicanPuget Sound SalishRomanianRussianSalvadoranSamoanScandinavianScotch-IrishScottishSeminoleSenegaleseSerbianShoshoneSierra LeoneanSiouxSlavicSlovakSloveneSomaliSouth AfricanSouth AmericanSouth American IndianSoviet UnionSpaniardSpanishSpanish AmericanSpanish American IndianSri LankanSubsaharan AfricanSudaneseSwedishSwissSyrianTaiwaneseThaiTlingit-HaidaTohono O'OdhamTonganTrinidadian and TobagonianTsimshianTurkishU.S. Virgin IslanderUgandanUkrainianUruguayanUteVenezuelanVietnameseWelshWest IndianYakamaYaquiYugoslavianYumanYup'ikZimbabwean
Immigration
NonimmigrantsImmigrantsAfghanistanAfricaAlbaniaArgentinaArmeniaAsiaAustraliaAustriaBahamasBangladeshBarbadosBelarusBelgiumBelizeBoliviaBosnia and HerzegovinaBrazilBulgariaBurma/MyanmarCabo VerdeCambodiaCameroonCanadaCaribbeanCentral AmericaChileChinaColombiaCongoCosta RicaCroatiaCubaCzechoslovakiaDenmarkDominicaDominican RepublicEastern AfricaEastern AsiaEastern EuropeEcuadorEgyptEl SalvadorEnglandEritreaEthiopiaEuropeFijiFranceGermanyGhanaGreeceGrenadaGuatemalaGuyanaHaitiHondurasHong KongHungaryIndiaIndonesiaIranIraqIrelandIsraelItalyJamaicaJapanJordanKazakhstanKenyaKoreaKuwaitLaosLatin AmericaLatviaLebanonLiberiaLithuaniaMalaysiaMexicoMicronesiaMiddle AfricaMoldovaMoroccoNepalNetherlandsNicaraguaNigeriaNorth AmericaNorth MacedoniaNorthern AfricaNorthern EuropeNorwayOceaniaPakistanPanamaPeruPhilippinesPolandPortugalRomaniaRussiaSaudi ArabiaScotlandSenegalSerbiaSierra LeoneSingaporeSomaliaSouth AfricaSouth AmericaSouth Central AsiaSouth Eastern AsiaSouthern EuropeSpainSri LankaSt. Vincent and the GrenadinesSudanSwedenSwitzerlandSyriaTaiwanThailandTrinidad and TobagoTurkeyUgandaUkraineUruguayUzbekistanVenezuelaVietnamWest IndiesWestern AfricaWestern AsiaWestern EuropeYemenZaireZimbabweAzores
Male Poverty
Income
Poverty
Unemployment
Labor Participation
Family Structure
Vehicle Availability
Education Level
Disability

Male Poverty Comparison

Macedonians

Sub-Saharan Africans

Exceptional
Tragic
9.7%
MALE POVERTY
99.5/ 100
METRIC RATING
32nd/ 347
METRIC RANK
13.3%
MALE POVERTY
0.1/ 100
METRIC RATING
268th/ 347
METRIC RANK

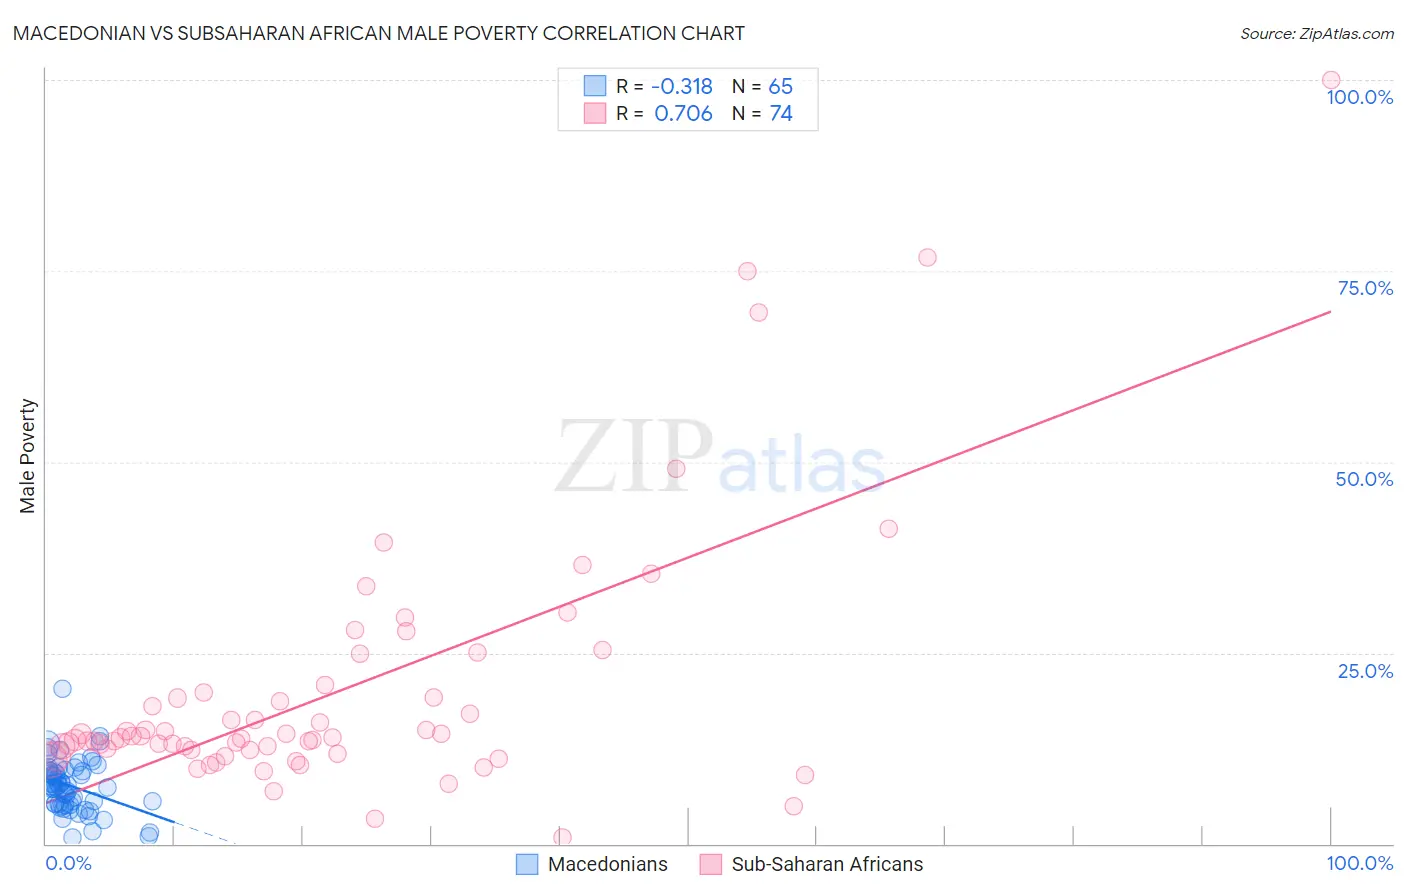
Macedonian vs Subsaharan African Male Poverty Correlation Chart

The statistical analysis conducted on geographies consisting of 132,583,851 people shows a mild negative correlation between the proportion of Macedonians and poverty level among males in the United States with a correlation coefficient (R) of -0.318 and weighted average of 9.7%. Similarly, the statistical analysis conducted on geographies consisting of 507,378,936 people shows a strong positive correlation between the proportion of Sub-Saharan Africans and poverty level among males in the United States with a correlation coefficient (R) of 0.706 and weighted average of 13.3%, a difference of 36.1%.
Macedonian vs Subsaharan African Male Poverty

Male Poverty Correlation Summary

MeasurementMacedonianSubsaharan African
Minimum0.75%0.81%
Maximum20.3%100.0%
Range19.6%99.2%
Mean7.6%20.0%
Median7.6%13.9%
Interquartile 25% (IQ1)5.1%12.3%
Interquartile 75% (IQ3)9.5%19.8%
Interquartile Range (IQR)4.4%7.6%
Standard Deviation (Sample)3.4%17.2%
Standard Deviation (Population)3.4%17.0%

Similar Demographics by Male Poverty

Demographics Similar to Macedonians by Male Poverty

In terms of male poverty, the demographic groups most similar to Macedonians are Immigrants from Northern Europe (9.7%, a difference of 0.090%), Tongan (9.7%, a difference of 0.21%), Polish (9.7%, a difference of 0.23%), Immigrants from Poland (9.8%, a difference of 0.23%), and Greek (9.7%, a difference of 0.30%).
DemographicsRating | RankMale Poverty
Eastern Europeans
99.6
/100
|
#25
Exceptional
9.6%
Burmese
99.6
/100
|
#26
Exceptional
9.7%
Danes
99.6
/100
|
#27
Exceptional
9.7%
Immigrants | Korea
99.6
/100
|
#28
Exceptional
9.7%
Greeks
99.6
/100
|
#29
Exceptional
9.7%
Poles
99.5
/100
|
#30
Exceptional
9.7%
Tongans
99.5
/100
|
#31
Exceptional
9.7%
Macedonians
99.5
/100
|
#32
Exceptional
9.7%
Immigrants | Northern Europe
99.5
/100
|
#33
Exceptional
9.7%
Immigrants | Poland
99.5
/100
|
#34
Exceptional
9.8%
Iranians
99.4
/100
|
#35
Exceptional
9.8%
Czechs
99.4
/100
|
#36
Exceptional
9.8%
Immigrants | Greece
99.3
/100
|
#37
Exceptional
9.8%
Immigrants | Pakistan
99.2
/100
|
#38
Exceptional
9.9%
Russians
99.2
/100
|
#39
Exceptional
9.9%

Demographics Similar to Sub-Saharan Africans by Male Poverty

In terms of male poverty, the demographic groups most similar to Sub-Saharan Africans are Immigrants from Jamaica (13.3%, a difference of 0.030%), Immigrants from Guyana (13.2%, a difference of 0.14%), Guyanese (13.3%, a difference of 0.22%), Jamaican (13.2%, a difference of 0.28%), and Iroquois (13.2%, a difference of 0.30%).
DemographicsRating | RankMale Poverty
Trinidadians and Tobagonians
0.1
/100
|
#261
Tragic
13.1%
Spanish American Indians
0.1
/100
|
#262
Tragic
13.1%
Central Americans
0.1
/100
|
#263
Tragic
13.2%
Iroquois
0.1
/100
|
#264
Tragic
13.2%
Jamaicans
0.1
/100
|
#265
Tragic
13.2%
Immigrants | Guyana
0.1
/100
|
#266
Tragic
13.2%
Immigrants | Jamaica
0.1
/100
|
#267
Tragic
13.3%
Sub-Saharan Africans
0.1
/100
|
#268
Tragic
13.3%
Guyanese
0.0
/100
|
#269
Tragic
13.3%
Cree
0.0
/100
|
#270
Tragic
13.3%
Spanish Americans
0.0
/100
|
#271
Tragic
13.4%
Immigrants | Bahamas
0.0
/100
|
#272
Tragic
13.5%
Chickasaw
0.0
/100
|
#273
Tragic
13.5%
Immigrants | West Indies
0.0
/100
|
#274
Tragic
13.5%
Barbadians
0.0
/100
|
#275
Tragic
13.6%