Luxembourger vs Immigrants from Netherlands Single Father Poverty

COMPARE

Luxembourger
Race
Ancestry
AfghanAfricanAlaska NativeAlaskan AthabascanAlbanianAleutAlsatianAmericanApacheArabArapahoArgentineanArmenianAssyrian/Chaldean/SyriacAustralianAustrianBahamianBangladeshiBarbadianBasqueBelgianBelizeanBermudanBhutaneseBlackfeetBolivianBrazilianBritishBritish West IndianBulgarianBurmeseCajunCambodianCanadianCape VerdeanCarpatho RusynCelticCentral AmericanCentral American IndianCherokeeCheyenneChickasawChileanChineseChippewaChoctawColombianColvilleComancheCosta RicanCreeCreekCroatianCrowCubanCypriotCzechCzechoslovakianDanishDelawareDominicanDutchDutch West IndianEastern EuropeanEcuadorianEgyptianEnglishEstonianEthiopianEuropeanFijianFilipinoFinnishFrenchFrench American IndianFrench CanadianGermanGerman RussianGhanaianGreekGuamanian/ChamorroGuatemalanGuyaneseHaitianHmongHonduranHopiHoumaHungarianIcelanderIndian (Asian)IndonesianInupiatIranianIraqiIrishIroquoisIsraeliItalianJamaicanJapaneseJordanianKenyanKiowaKoreanLaotianLatvianLebaneseLiberianLithuanianLumbeeLuxembourgerMacedonianMalaysianMalteseMarshalleseMenomineeMexicanMexican American IndianMongolianMoroccanNative HawaiianNavajoNepaleseNew ZealanderNicaraguanNigerianNorthern EuropeanNorwegianOkinawanOsageOttawaPaiutePakistaniPalestinianPanamanianParaguayanPennsylvania GermanPeruvianPimaPolishPortuguesePotawatomiPuebloPuerto RicanPuget Sound SalishRomanianRussianSalvadoranSamoanScandinavianScotch-IrishScottishSeminoleSenegaleseSerbianShoshoneSierra LeoneanSiouxSlavicSlovakSloveneSomaliSouth AfricanSouth AmericanSouth American IndianSoviet UnionSpaniardSpanishSpanish AmericanSpanish American IndianSri LankanSubsaharan AfricanSudaneseSwedishSwissSyrianTaiwaneseThaiTlingit-HaidaTohono O'OdhamTonganTrinidadian and TobagonianTsimshianTurkishU.S. Virgin IslanderUgandanUkrainianUruguayanUteVenezuelanVietnameseWelshWest IndianYakamaYaquiYugoslavianYumanYup'ikZimbabwean
Immigration
NonimmigrantsImmigrantsAfghanistanAfricaAlbaniaArgentinaArmeniaAsiaAustraliaAustriaBahamasBangladeshBarbadosBelarusBelgiumBelizeBoliviaBosnia and HerzegovinaBrazilBulgariaBurma/MyanmarCabo VerdeCambodiaCameroonCanadaCaribbeanCentral AmericaChileChinaColombiaCongoCosta RicaCroatiaCubaCzechoslovakiaDenmarkDominicaDominican RepublicEastern AfricaEastern AsiaEastern EuropeEcuadorEgyptEl SalvadorEnglandEritreaEthiopiaEuropeFijiFranceGermanyGhanaGreeceGrenadaGuatemalaGuyanaHaitiHondurasHong KongHungaryIndiaIndonesiaIranIraqIrelandIsraelItalyJamaicaJapanJordanKazakhstanKenyaKoreaKuwaitLaosLatin AmericaLatviaLebanonLiberiaLithuaniaMalaysiaMexicoMicronesiaMiddle AfricaMoldovaMoroccoNepalNicaraguaNigeriaNorth AmericaNorth MacedoniaNorthern AfricaNorthern EuropeNorwayOceaniaPakistanPanamaPeruPhilippinesPolandPortugalRomaniaRussiaSaudi ArabiaScotlandSenegalSerbiaSierra LeoneSingaporeSomaliaSouth AfricaSouth AmericaSouth Central AsiaSouth Eastern AsiaSouthern EuropeSpainSri LankaSt. Vincent and the GrenadinesSudanSwedenSwitzerlandSyriaTaiwanThailandTrinidad and TobagoTurkeyUgandaUkraineUruguayUzbekistanVenezuelaVietnamWest IndiesWestern AfricaWestern AsiaWestern EuropeYemenZaireZimbabweAzores
Immigrants from Netherlands
Race
Ancestry
AfghanAfricanAlaska NativeAlaskan AthabascanAlbanianAleutAlsatianAmericanApacheArabArapahoArgentineanArmenianAssyrian/Chaldean/SyriacAustralianAustrianBahamianBangladeshiBarbadianBasqueBelgianBelizeanBermudanBhutaneseBlackfeetBolivianBrazilianBritishBritish West IndianBulgarianBurmeseCajunCambodianCanadianCape VerdeanCarpatho RusynCelticCentral AmericanCentral American IndianCherokeeCheyenneChickasawChileanChineseChippewaChoctawColombianColvilleComancheCosta RicanCreeCreekCroatianCrowCubanCypriotCzechCzechoslovakianDanishDelawareDominicanDutchDutch West IndianEastern EuropeanEcuadorianEgyptianEnglishEstonianEthiopianEuropeanFijianFilipinoFinnishFrenchFrench American IndianFrench CanadianGermanGerman RussianGhanaianGreekGuamanian/ChamorroGuatemalanGuyaneseHaitianHmongHonduranHopiHoumaHungarianIcelanderIndian (Asian)IndonesianInupiatIranianIraqiIrishIroquoisIsraeliItalianJamaicanJapaneseJordanianKenyanKiowaKoreanLaotianLatvianLebaneseLiberianLithuanianLumbeeMacedonianMalaysianMalteseMarshalleseMenomineeMexicanMexican American IndianMongolianMoroccanNative HawaiianNavajoNepaleseNew ZealanderNicaraguanNigerianNorthern EuropeanNorwegianOkinawanOsageOttawaPaiutePakistaniPalestinianPanamanianParaguayanPennsylvania GermanPeruvianPimaPolishPortuguesePotawatomiPuebloPuerto RicanPuget Sound SalishRomanianRussianSalvadoranSamoanScandinavianScotch-IrishScottishSeminoleSenegaleseSerbianShoshoneSierra LeoneanSiouxSlavicSlovakSloveneSomaliSouth AfricanSouth AmericanSouth American IndianSoviet UnionSpaniardSpanishSpanish AmericanSpanish American IndianSri LankanSubsaharan AfricanSudaneseSwedishSwissSyrianTaiwaneseThaiTlingit-HaidaTohono O'OdhamTonganTrinidadian and TobagonianTsimshianTurkishU.S. Virgin IslanderUgandanUkrainianUruguayanUteVenezuelanVietnameseWelshWest IndianYakamaYaquiYugoslavianYumanYup'ikZimbabwean
Immigration
NonimmigrantsImmigrantsAfghanistanAfricaAlbaniaArgentinaArmeniaAsiaAustraliaAustriaBahamasBangladeshBarbadosBelarusBelgiumBelizeBoliviaBosnia and HerzegovinaBrazilBulgariaBurma/MyanmarCabo VerdeCambodiaCameroonCanadaCaribbeanCentral AmericaChileChinaColombiaCongoCosta RicaCroatiaCubaCzechoslovakiaDenmarkDominicaDominican RepublicEastern AfricaEastern AsiaEastern EuropeEcuadorEgyptEl SalvadorEnglandEritreaEthiopiaEuropeFijiFranceGermanyGhanaGreeceGrenadaGuatemalaGuyanaHaitiHondurasHong KongHungaryIndiaIndonesiaIranIraqIrelandIsraelItalyJamaicaJapanJordanKazakhstanKenyaKoreaKuwaitLaosLatin AmericaLatviaLebanonLiberiaLithuaniaMalaysiaMexicoMicronesiaMiddle AfricaMoldovaMoroccoNepalNetherlandsNicaraguaNigeriaNorth AmericaNorth MacedoniaNorthern AfricaNorthern EuropeNorwayOceaniaPakistanPanamaPeruPhilippinesPolandPortugalRomaniaRussiaSaudi ArabiaScotlandSenegalSerbiaSierra LeoneSingaporeSomaliaSouth AfricaSouth AmericaSouth Central AsiaSouth Eastern AsiaSouthern EuropeSpainSri LankaSt. Vincent and the GrenadinesSudanSwedenSwitzerlandSyriaTaiwanThailandTrinidad and TobagoTurkeyUgandaUkraineUruguayUzbekistanVenezuelaVietnamWest IndiesWestern AfricaWestern AsiaWestern EuropeYemenZaireZimbabweAzores
Single Father Poverty
Income
Poverty
Unemployment
Labor Participation
Family Structure
Vehicle Availability
Education Level
Disability

Single Father Poverty Comparison

Luxembourgers

Immigrants from Netherlands

Tragic
Excellent
17.1%
SINGLE FATHER POVERTY
1.1/ 100
METRIC RATING
251st/ 347
METRIC RANK
16.0%
SINGLE FATHER POVERTY
85.3/ 100
METRIC RATING
140th/ 347
METRIC RANK

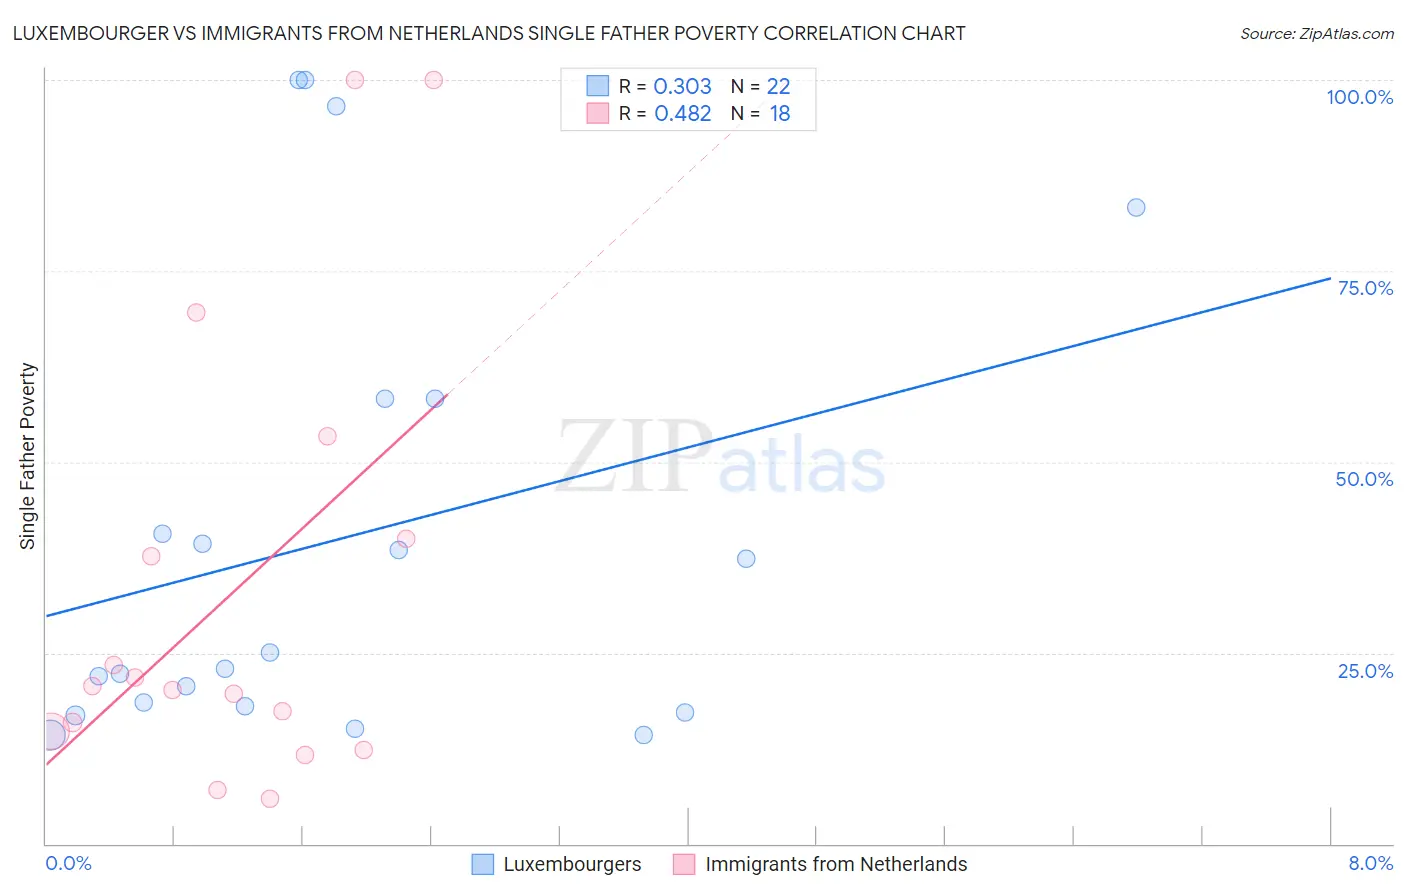
Luxembourger vs Immigrants from Netherlands Single Father Poverty Correlation Chart

The statistical analysis conducted on geographies consisting of 123,209,888 people shows a mild positive correlation between the proportion of Luxembourgers and poverty level among single fathers in the United States with a correlation coefficient (R) of 0.303 and weighted average of 17.1%. Similarly, the statistical analysis conducted on geographies consisting of 195,225,242 people shows a moderate positive correlation between the proportion of Immigrants from Netherlands and poverty level among single fathers in the United States with a correlation coefficient (R) of 0.482 and weighted average of 16.0%, a difference of 7.0%.
Luxembourger vs Immigrants from Netherlands Single Father Poverty

Single Father Poverty Correlation Summary

MeasurementLuxembourgerImmigrants from Netherlands
Minimum14.2%6.0%
Maximum100.0%100.0%
Range85.8%94.0%
Mean40.0%32.8%
Median24.0%20.4%
Interquartile 25% (IQ1)18.0%14.7%
Interquartile 75% (IQ3)58.3%40.0%
Interquartile Range (IQR)40.4%25.3%
Standard Deviation (Sample)29.6%29.4%
Standard Deviation (Population)29.0%28.6%

Similar Demographics by Single Father Poverty

Demographics Similar to Luxembourgers by Single Father Poverty

In terms of single father poverty, the demographic groups most similar to Luxembourgers are Austrian (17.1%, a difference of 0.010%), Croatian (17.1%, a difference of 0.10%), Cree (17.1%, a difference of 0.11%), Canadian (17.1%, a difference of 0.14%), and Greek (17.1%, a difference of 0.18%).
DemographicsRating | RankSingle Father Poverty
Hondurans
1.6
/100
|
#244
Tragic
17.0%
Trinidadians and Tobagonians
1.5
/100
|
#245
Tragic
17.0%
Immigrants | Ireland
1.4
/100
|
#246
Tragic
17.1%
Greeks
1.3
/100
|
#247
Tragic
17.1%
Czechoslovakians
1.3
/100
|
#248
Tragic
17.1%
Canadians
1.3
/100
|
#249
Tragic
17.1%
Austrians
1.1
/100
|
#250
Tragic
17.1%
Luxembourgers
1.1
/100
|
#251
Tragic
17.1%
Croatians
1.0
/100
|
#252
Tragic
17.1%
Cree
1.0
/100
|
#253
Tragic
17.1%
Immigrants | Honduras
0.9
/100
|
#254
Tragic
17.1%
Sierra Leoneans
0.8
/100
|
#255
Tragic
17.2%
Immigrants | Haiti
0.8
/100
|
#256
Tragic
17.2%
Immigrants | Albania
0.7
/100
|
#257
Tragic
17.2%
Albanians
0.7
/100
|
#258
Tragic
17.2%

Demographics Similar to Immigrants from Netherlands by Single Father Poverty

In terms of single father poverty, the demographic groups most similar to Immigrants from Netherlands are South American (16.0%, a difference of 0.050%), Central American (16.0%, a difference of 0.17%), Liberian (16.0%, a difference of 0.17%), Immigrants from Mexico (16.0%, a difference of 0.17%), and Immigrants from the Azores (15.9%, a difference of 0.18%).
DemographicsRating | RankSingle Father Poverty
Immigrants | Syria
89.5
/100
|
#133
Excellent
15.9%
Immigrants | South America
88.5
/100
|
#134
Excellent
15.9%
Immigrants | Sri Lanka
88.2
/100
|
#135
Excellent
15.9%
Cypriots
87.5
/100
|
#136
Excellent
15.9%
Immigrants | Azores
87.2
/100
|
#137
Excellent
15.9%
Central Americans
87.1
/100
|
#138
Excellent
16.0%
South Americans
85.9
/100
|
#139
Excellent
16.0%
Immigrants | Netherlands
85.3
/100
|
#140
Excellent
16.0%
Liberians
83.3
/100
|
#141
Excellent
16.0%
Immigrants | Mexico
83.3
/100
|
#142
Excellent
16.0%
Immigrants | Central America
83.1
/100
|
#143
Excellent
16.0%
Immigrants | Kuwait
81.4
/100
|
#144
Excellent
16.0%
Immigrants | Western Asia
80.7
/100
|
#145
Excellent
16.0%
Immigrants | Hungary
78.3
/100
|
#146
Good
16.1%
Colombians
77.1
/100
|
#147
Good
16.1%