Luxembourger vs Immigrants from Middle Africa Female Poverty

COMPARE

Luxembourger
Race
Ancestry
AfghanAfricanAlaska NativeAlaskan AthabascanAlbanianAleutAlsatianAmericanApacheArabArapahoArgentineanArmenianAssyrian/Chaldean/SyriacAustralianAustrianBahamianBangladeshiBarbadianBasqueBelgianBelizeanBermudanBhutaneseBlackfeetBolivianBrazilianBritishBritish West IndianBulgarianBurmeseCajunCambodianCanadianCape VerdeanCarpatho RusynCelticCentral AmericanCentral American IndianCherokeeCheyenneChickasawChileanChineseChippewaChoctawColombianColvilleComancheCosta RicanCreeCreekCroatianCrowCubanCypriotCzechCzechoslovakianDanishDelawareDominicanDutchDutch West IndianEastern EuropeanEcuadorianEgyptianEnglishEstonianEthiopianEuropeanFijianFilipinoFinnishFrenchFrench American IndianFrench CanadianGermanGerman RussianGhanaianGreekGuamanian/ChamorroGuatemalanGuyaneseHaitianHmongHonduranHopiHoumaHungarianIcelanderIndian (Asian)IndonesianInupiatIranianIraqiIrishIroquoisIsraeliItalianJamaicanJapaneseJordanianKenyanKiowaKoreanLaotianLatvianLebaneseLiberianLithuanianLumbeeLuxembourgerMacedonianMalaysianMalteseMarshalleseMenomineeMexicanMexican American IndianMongolianMoroccanNative HawaiianNavajoNepaleseNew ZealanderNicaraguanNigerianNorthern EuropeanNorwegianOkinawanOsageOttawaPaiutePakistaniPalestinianPanamanianParaguayanPennsylvania GermanPeruvianPimaPolishPortuguesePotawatomiPuebloPuerto RicanPuget Sound SalishRomanianRussianSalvadoranSamoanScandinavianScotch-IrishScottishSeminoleSenegaleseSerbianShoshoneSierra LeoneanSiouxSlavicSlovakSloveneSomaliSouth AfricanSouth AmericanSouth American IndianSoviet UnionSpaniardSpanishSpanish AmericanSpanish American IndianSri LankanSubsaharan AfricanSudaneseSwedishSwissSyrianTaiwaneseThaiTlingit-HaidaTohono O'OdhamTonganTrinidadian and TobagonianTsimshianTurkishU.S. Virgin IslanderUgandanUkrainianUruguayanUteVenezuelanVietnameseWelshWest IndianYakamaYaquiYugoslavianYumanYup'ikZimbabwean
Immigration
NonimmigrantsImmigrantsAfghanistanAfricaAlbaniaArgentinaArmeniaAsiaAustraliaAustriaBahamasBangladeshBarbadosBelarusBelgiumBelizeBoliviaBosnia and HerzegovinaBrazilBulgariaBurma/MyanmarCabo VerdeCambodiaCameroonCanadaCaribbeanCentral AmericaChileChinaColombiaCongoCosta RicaCroatiaCubaCzechoslovakiaDenmarkDominicaDominican RepublicEastern AfricaEastern AsiaEastern EuropeEcuadorEgyptEl SalvadorEnglandEritreaEthiopiaEuropeFijiFranceGermanyGhanaGreeceGrenadaGuatemalaGuyanaHaitiHondurasHong KongHungaryIndiaIndonesiaIranIraqIrelandIsraelItalyJamaicaJapanJordanKazakhstanKenyaKoreaKuwaitLaosLatin AmericaLatviaLebanonLiberiaLithuaniaMalaysiaMexicoMicronesiaMoldovaMoroccoNepalNetherlandsNicaraguaNigeriaNorth AmericaNorth MacedoniaNorthern AfricaNorthern EuropeNorwayOceaniaPakistanPanamaPeruPhilippinesPolandPortugalRomaniaRussiaSaudi ArabiaScotlandSenegalSerbiaSierra LeoneSingaporeSomaliaSouth AfricaSouth AmericaSouth Central AsiaSouth Eastern AsiaSouthern EuropeSpainSri LankaSt. Vincent and the GrenadinesSudanSwedenSwitzerlandSyriaTaiwanThailandTrinidad and TobagoTurkeyUgandaUkraineUruguayUzbekistanVenezuelaVietnamWest IndiesWestern AfricaWestern AsiaWestern EuropeYemenZaireZimbabweAzores
Immigrants from Middle Africa
Race
Ancestry
AfghanAfricanAlaska NativeAlaskan AthabascanAlbanianAleutAlsatianAmericanApacheArabArapahoArgentineanArmenianAssyrian/Chaldean/SyriacAustralianAustrianBahamianBangladeshiBarbadianBasqueBelgianBelizeanBermudanBhutaneseBlackfeetBolivianBrazilianBritishBritish West IndianBulgarianBurmeseCajunCambodianCanadianCape VerdeanCarpatho RusynCelticCentral AmericanCentral American IndianCherokeeCheyenneChickasawChileanChineseChippewaChoctawColombianColvilleComancheCosta RicanCreeCreekCroatianCrowCubanCypriotCzechCzechoslovakianDanishDelawareDominicanDutchDutch West IndianEastern EuropeanEcuadorianEgyptianEnglishEstonianEthiopianEuropeanFijianFilipinoFinnishFrenchFrench American IndianFrench CanadianGermanGerman RussianGhanaianGreekGuamanian/ChamorroGuatemalanGuyaneseHaitianHmongHonduranHopiHoumaHungarianIcelanderIndian (Asian)IndonesianInupiatIranianIraqiIrishIroquoisIsraeliItalianJamaicanJapaneseJordanianKenyanKiowaKoreanLaotianLatvianLebaneseLiberianLithuanianLumbeeMacedonianMalaysianMalteseMarshalleseMenomineeMexicanMexican American IndianMongolianMoroccanNative HawaiianNavajoNepaleseNew ZealanderNicaraguanNigerianNorthern EuropeanNorwegianOkinawanOsageOttawaPaiutePakistaniPalestinianPanamanianParaguayanPennsylvania GermanPeruvianPimaPolishPortuguesePotawatomiPuebloPuerto RicanPuget Sound SalishRomanianRussianSalvadoranSamoanScandinavianScotch-IrishScottishSeminoleSenegaleseSerbianShoshoneSierra LeoneanSiouxSlavicSlovakSloveneSomaliSouth AfricanSouth AmericanSouth American IndianSoviet UnionSpaniardSpanishSpanish AmericanSpanish American IndianSri LankanSubsaharan AfricanSudaneseSwedishSwissSyrianTaiwaneseThaiTlingit-HaidaTohono O'OdhamTonganTrinidadian and TobagonianTsimshianTurkishU.S. Virgin IslanderUgandanUkrainianUruguayanUteVenezuelanVietnameseWelshWest IndianYakamaYaquiYugoslavianYumanYup'ikZimbabwean
Immigration
NonimmigrantsImmigrantsAfghanistanAfricaAlbaniaArgentinaArmeniaAsiaAustraliaAustriaBahamasBangladeshBarbadosBelarusBelgiumBelizeBoliviaBosnia and HerzegovinaBrazilBulgariaBurma/MyanmarCabo VerdeCambodiaCameroonCanadaCaribbeanCentral AmericaChileChinaColombiaCongoCosta RicaCroatiaCubaCzechoslovakiaDenmarkDominicaDominican RepublicEastern AfricaEastern AsiaEastern EuropeEcuadorEgyptEl SalvadorEnglandEritreaEthiopiaEuropeFijiFranceGermanyGhanaGreeceGrenadaGuatemalaGuyanaHaitiHondurasHong KongHungaryIndiaIndonesiaIranIraqIrelandIsraelItalyJamaicaJapanJordanKazakhstanKenyaKoreaKuwaitLaosLatin AmericaLatviaLebanonLiberiaLithuaniaMalaysiaMexicoMicronesiaMiddle AfricaMoldovaMoroccoNepalNetherlandsNicaraguaNigeriaNorth AmericaNorth MacedoniaNorthern AfricaNorthern EuropeNorwayOceaniaPakistanPanamaPeruPhilippinesPolandPortugalRomaniaRussiaSaudi ArabiaScotlandSenegalSerbiaSierra LeoneSingaporeSomaliaSouth AfricaSouth AmericaSouth Central AsiaSouth Eastern AsiaSouthern EuropeSpainSri LankaSt. Vincent and the GrenadinesSudanSwedenSwitzerlandSyriaTaiwanThailandTrinidad and TobagoTurkeyUgandaUkraineUruguayUzbekistanVenezuelaVietnamWest IndiesWestern AfricaWestern AsiaWestern EuropeYemenZaireZimbabweAzores
Female Poverty
Income
Poverty
Unemployment
Labor Participation
Family Structure
Vehicle Availability
Education Level
Disability

Female Poverty Comparison

Luxembourgers

Immigrants from Middle Africa

Exceptional
Tragic
11.6%
FEMALE POVERTY
99.7/ 100
METRIC RATING
24th/ 347
METRIC RANK
15.2%
FEMALE POVERTY
0.5/ 100
METRIC RATING
239th/ 347
METRIC RANK

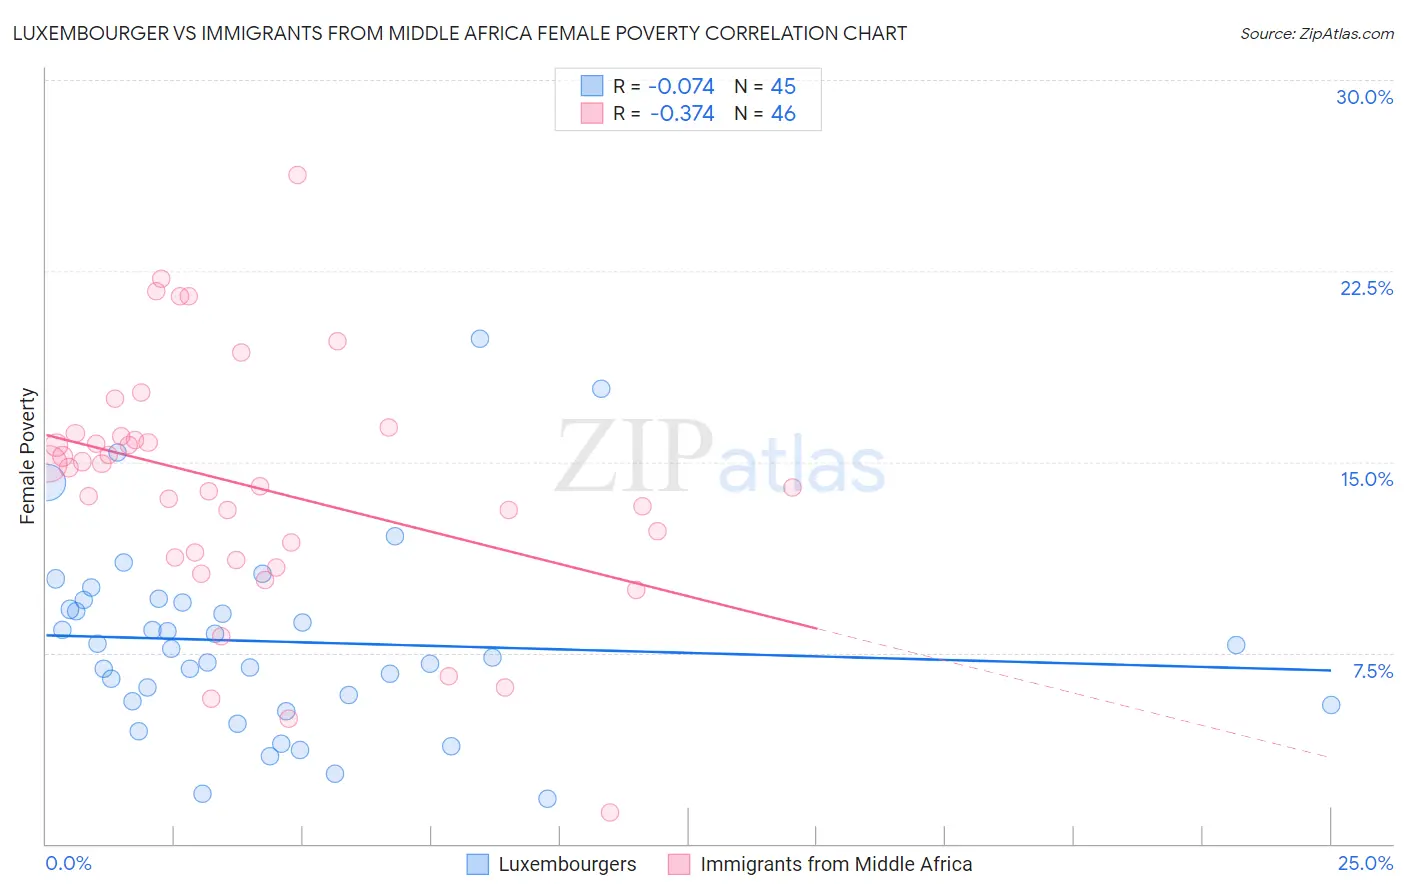
Luxembourger vs Immigrants from Middle Africa Female Poverty Correlation Chart

The statistical analysis conducted on geographies consisting of 144,645,818 people shows a slight negative correlation between the proportion of Luxembourgers and poverty level among females in the United States with a correlation coefficient (R) of -0.074 and weighted average of 11.6%. Similarly, the statistical analysis conducted on geographies consisting of 202,623,141 people shows a mild negative correlation between the proportion of Immigrants from Middle Africa and poverty level among females in the United States with a correlation coefficient (R) of -0.374 and weighted average of 15.2%, a difference of 30.7%.
Luxembourger vs Immigrants from Middle Africa Female Poverty

Female Poverty Correlation Summary

MeasurementLuxembourgerImmigrants from Middle Africa
Minimum1.8%1.2%
Maximum19.8%26.2%
Range18.1%25.0%
Mean7.9%14.0%
Median7.7%14.4%
Interquartile 25% (IQ1)5.5%11.2%
Interquartile 75% (IQ3)9.5%16.0%
Interquartile Range (IQR)4.0%4.8%
Standard Deviation (Sample)3.8%4.9%
Standard Deviation (Population)3.7%4.8%

Similar Demographics by Female Poverty

Demographics Similar to Luxembourgers by Female Poverty

In terms of female poverty, the demographic groups most similar to Luxembourgers are Burmese (11.6%, a difference of 0.020%), Swedish (11.6%, a difference of 0.16%), Italian (11.6%, a difference of 0.19%), Immigrants from Northern Europe (11.6%, a difference of 0.26%), and Croatian (11.6%, a difference of 0.27%).
DemographicsRating | RankFemale Poverty
Bolivians
99.8
/100
|
#17
Exceptional
11.5%
Immigrants | Scotland
99.8
/100
|
#18
Exceptional
11.5%
Norwegians
99.8
/100
|
#19
Exceptional
11.5%
Eastern Europeans
99.7
/100
|
#20
Exceptional
11.5%
Italians
99.7
/100
|
#21
Exceptional
11.6%
Swedes
99.7
/100
|
#22
Exceptional
11.6%
Burmese
99.7
/100
|
#23
Exceptional
11.6%
Luxembourgers
99.7
/100
|
#24
Exceptional
11.6%
Immigrants | Northern Europe
99.6
/100
|
#25
Exceptional
11.6%
Croatians
99.6
/100
|
#26
Exceptional
11.6%
Iranians
99.6
/100
|
#27
Exceptional
11.7%
Immigrants | Korea
99.6
/100
|
#28
Exceptional
11.7%
Immigrants | North Macedonia
99.6
/100
|
#29
Exceptional
11.7%
Greeks
99.5
/100
|
#30
Exceptional
11.7%
Poles
99.5
/100
|
#31
Exceptional
11.7%

Demographics Similar to Immigrants from Middle Africa by Female Poverty

In terms of female poverty, the demographic groups most similar to Immigrants from Middle Africa are Sudanese (15.2%, a difference of 0.050%), Immigrants from Sudan (15.2%, a difference of 0.30%), Nepalese (15.2%, a difference of 0.42%), Immigrants from Armenia (15.1%, a difference of 0.52%), and French American Indian (15.1%, a difference of 0.59%).
DemographicsRating | RankFemale Poverty
Osage
1.5
/100
|
#232
Tragic
14.8%
Immigrants | Saudi Arabia
1.4
/100
|
#233
Tragic
14.8%
Fijians
1.1
/100
|
#234
Tragic
14.9%
Immigrants | Laos
0.9
/100
|
#235
Tragic
15.0%
Cree
0.7
/100
|
#236
Tragic
15.1%
French American Indians
0.6
/100
|
#237
Tragic
15.1%
Immigrants | Armenia
0.6
/100
|
#238
Tragic
15.1%
Immigrants | Middle Africa
0.5
/100
|
#239
Tragic
15.2%
Sudanese
0.5
/100
|
#240
Tragic
15.2%
Immigrants | Sudan
0.4
/100
|
#241
Tragic
15.2%
Nepalese
0.4
/100
|
#242
Tragic
15.2%
Nicaraguans
0.3
/100
|
#243
Tragic
15.3%
Ecuadorians
0.3
/100
|
#244
Tragic
15.3%
Spanish American Indians
0.3
/100
|
#245
Tragic
15.3%
Cubans
0.3
/100
|
#246
Tragic
15.3%