Lithuanian vs Peruvian Child Poverty Among Boys Under 16

COMPARE

Lithuanian
Race
Ancestry
AfghanAfricanAlaska NativeAlaskan AthabascanAlbanianAleutAlsatianAmericanApacheArabArapahoArgentineanArmenianAssyrian/Chaldean/SyriacAustralianAustrianBahamianBangladeshiBarbadianBasqueBelgianBelizeanBermudanBhutaneseBlackfeetBolivianBrazilianBritishBritish West IndianBulgarianBurmeseCajunCambodianCanadianCape VerdeanCarpatho RusynCelticCentral AmericanCentral American IndianCherokeeCheyenneChickasawChileanChineseChippewaChoctawColombianColvilleComancheCosta RicanCreeCreekCroatianCrowCubanCypriotCzechCzechoslovakianDanishDelawareDominicanDutchDutch West IndianEastern EuropeanEcuadorianEgyptianEnglishEstonianEthiopianEuropeanFijianFilipinoFinnishFrenchFrench American IndianFrench CanadianGermanGerman RussianGhanaianGreekGuamanian/ChamorroGuatemalanGuyaneseHaitianHmongHonduranHopiHoumaHungarianIcelanderIndian (Asian)IndonesianInupiatIranianIraqiIrishIroquoisIsraeliItalianJamaicanJapaneseJordanianKenyanKiowaKoreanLaotianLatvianLebaneseLiberianLithuanianLumbeeLuxembourgerMacedonianMalaysianMalteseMarshalleseMenomineeMexicanMexican American IndianMongolianMoroccanNative HawaiianNavajoNepaleseNew ZealanderNicaraguanNigerianNorthern EuropeanNorwegianOkinawanOsageOttawaPaiutePakistaniPalestinianPanamanianParaguayanPennsylvania GermanPimaPolishPortuguesePotawatomiPuebloPuerto RicanPuget Sound SalishRomanianRussianSalvadoranSamoanScandinavianScotch-IrishScottishSeminoleSenegaleseSerbianShoshoneSierra LeoneanSiouxSlavicSlovakSloveneSomaliSouth AfricanSouth AmericanSouth American IndianSoviet UnionSpaniardSpanishSpanish AmericanSpanish American IndianSri LankanSubsaharan AfricanSudaneseSwedishSwissSyrianTaiwaneseThaiTlingit-HaidaTohono O'OdhamTonganTrinidadian and TobagonianTsimshianTurkishU.S. Virgin IslanderUgandanUkrainianUruguayanUteVenezuelanVietnameseWelshWest IndianYakamaYaquiYugoslavianYumanYup'ikZimbabwean
Immigration
NonimmigrantsImmigrantsAfghanistanAfricaAlbaniaArgentinaArmeniaAsiaAustraliaAustriaBahamasBangladeshBarbadosBelarusBelgiumBelizeBoliviaBosnia and HerzegovinaBrazilBulgariaBurma/MyanmarCabo VerdeCambodiaCameroonCanadaCaribbeanCentral AmericaChileChinaColombiaCongoCosta RicaCroatiaCubaCzechoslovakiaDenmarkDominicaDominican RepublicEastern AfricaEastern AsiaEastern EuropeEcuadorEgyptEl SalvadorEnglandEritreaEthiopiaEuropeFijiFranceGermanyGhanaGreeceGrenadaGuatemalaGuyanaHaitiHondurasHong KongHungaryIndiaIndonesiaIranIraqIrelandIsraelItalyJamaicaJapanJordanKazakhstanKenyaKoreaKuwaitLaosLatin AmericaLatviaLebanonLiberiaLithuaniaMalaysiaMexicoMicronesiaMiddle AfricaMoldovaMoroccoNepalNetherlandsNicaraguaNigeriaNorth AmericaNorth MacedoniaNorthern AfricaNorthern EuropeNorwayOceaniaPakistanPanamaPeruPhilippinesPolandPortugalRomaniaRussiaSaudi ArabiaScotlandSenegalSerbiaSierra LeoneSingaporeSomaliaSouth AfricaSouth AmericaSouth Central AsiaSouth Eastern AsiaSouthern EuropeSpainSri LankaSt. Vincent and the GrenadinesSudanSwedenSwitzerlandSyriaTaiwanThailandTrinidad and TobagoTurkeyUgandaUkraineUruguayUzbekistanVenezuelaVietnamWest IndiesWestern AfricaWestern AsiaWestern EuropeYemenZaireZimbabweAzores
Peruvian
Race
Ancestry
AfghanAfricanAlaska NativeAlaskan AthabascanAlbanianAleutAlsatianAmericanApacheArabArapahoArgentineanArmenianAssyrian/Chaldean/SyriacAustralianAustrianBahamianBangladeshiBarbadianBasqueBelgianBelizeanBermudanBhutaneseBlackfeetBolivianBrazilianBritishBritish West IndianBulgarianBurmeseCajunCambodianCanadianCape VerdeanCarpatho RusynCelticCentral AmericanCentral American IndianCherokeeCheyenneChickasawChileanChineseChippewaChoctawColombianColvilleComancheCosta RicanCreeCreekCroatianCrowCubanCypriotCzechCzechoslovakianDanishDelawareDominicanDutchDutch West IndianEastern EuropeanEcuadorianEgyptianEnglishEstonianEthiopianEuropeanFijianFilipinoFinnishFrenchFrench American IndianFrench CanadianGermanGerman RussianGhanaianGreekGuamanian/ChamorroGuatemalanGuyaneseHaitianHmongHonduranHopiHoumaHungarianIcelanderIndian (Asian)IndonesianInupiatIranianIraqiIrishIroquoisIsraeliItalianJamaicanJapaneseJordanianKenyanKiowaKoreanLaotianLatvianLebaneseLiberianLumbeeLuxembourgerMacedonianMalaysianMalteseMarshalleseMenomineeMexicanMexican American IndianMongolianMoroccanNative HawaiianNavajoNepaleseNew ZealanderNicaraguanNigerianNorthern EuropeanNorwegianOkinawanOsageOttawaPaiutePakistaniPalestinianPanamanianParaguayanPennsylvania GermanPeruvianPimaPolishPortuguesePotawatomiPuebloPuerto RicanPuget Sound SalishRomanianRussianSalvadoranSamoanScandinavianScotch-IrishScottishSeminoleSenegaleseSerbianShoshoneSierra LeoneanSiouxSlavicSlovakSloveneSomaliSouth AfricanSouth AmericanSouth American IndianSoviet UnionSpaniardSpanishSpanish AmericanSpanish American IndianSri LankanSubsaharan AfricanSudaneseSwedishSwissSyrianTaiwaneseThaiTlingit-HaidaTohono O'OdhamTonganTrinidadian and TobagonianTsimshianTurkishU.S. Virgin IslanderUgandanUkrainianUruguayanUteVenezuelanVietnameseWelshWest IndianYakamaYaquiYugoslavianYumanYup'ikZimbabwean
Immigration
NonimmigrantsImmigrantsAfghanistanAfricaAlbaniaArgentinaArmeniaAsiaAustraliaAustriaBahamasBangladeshBarbadosBelarusBelgiumBelizeBoliviaBosnia and HerzegovinaBrazilBulgariaBurma/MyanmarCabo VerdeCambodiaCameroonCanadaCaribbeanCentral AmericaChileChinaColombiaCongoCosta RicaCroatiaCubaCzechoslovakiaDenmarkDominicaDominican RepublicEastern AfricaEastern AsiaEastern EuropeEcuadorEgyptEl SalvadorEnglandEritreaEthiopiaEuropeFijiFranceGermanyGhanaGreeceGrenadaGuatemalaGuyanaHaitiHondurasHong KongHungaryIndiaIndonesiaIranIraqIrelandIsraelItalyJamaicaJapanJordanKazakhstanKenyaKoreaKuwaitLaosLatin AmericaLatviaLebanonLiberiaLithuaniaMalaysiaMexicoMicronesiaMiddle AfricaMoldovaMoroccoNepalNetherlandsNicaraguaNigeriaNorth AmericaNorth MacedoniaNorthern AfricaNorthern EuropeNorwayOceaniaPakistanPanamaPeruPhilippinesPolandPortugalRomaniaRussiaSaudi ArabiaScotlandSenegalSerbiaSierra LeoneSingaporeSomaliaSouth AfricaSouth AmericaSouth Central AsiaSouth Eastern AsiaSouthern EuropeSpainSri LankaSt. Vincent and the GrenadinesSudanSwedenSwitzerlandSyriaTaiwanThailandTrinidad and TobagoTurkeyUgandaUkraineUruguayUzbekistanVenezuelaVietnamWest IndiesWestern AfricaWestern AsiaWestern EuropeYemenZaireZimbabweAzores
Child Poverty Among Boys Under 16
Income
Poverty
Unemployment
Labor Participation
Family Structure
Vehicle Availability
Education Level
Disability

Child Poverty Among Boys Under 16 Comparison

Lithuanians

Peruvians

Exceptional
Excellent
14.0%
CHILD POVERTY AMONG BOYS UNDER 16
99.6/ 100
METRIC RATING
41st/ 347
METRIC RANK
15.5%
CHILD POVERTY AMONG BOYS UNDER 16
88.1/ 100
METRIC RATING
134th/ 347
METRIC RANK

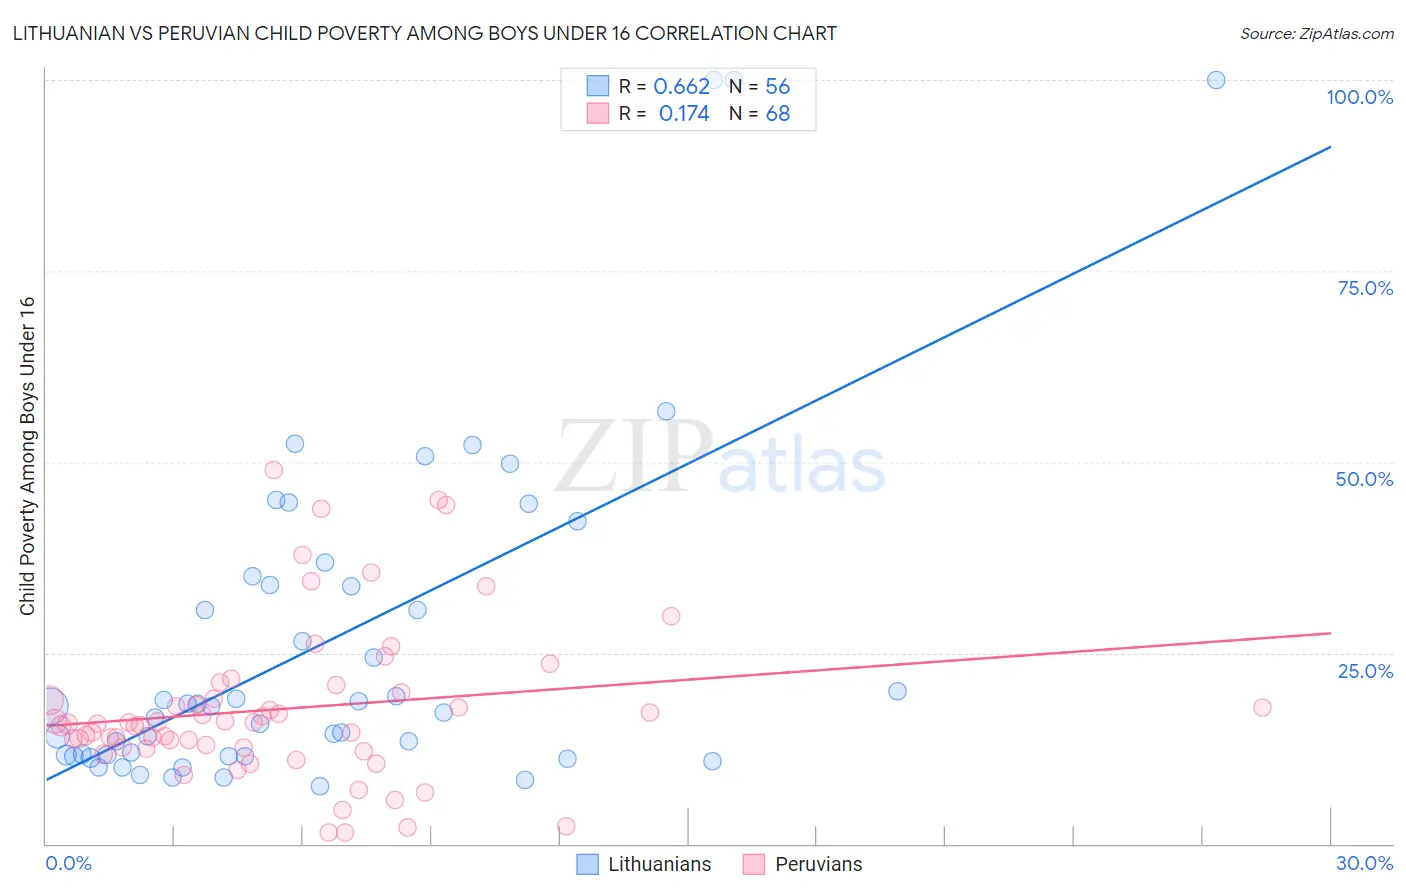
Lithuanian vs Peruvian Child Poverty Among Boys Under 16 Correlation Chart

The statistical analysis conducted on geographies consisting of 411,360,859 people shows a significant positive correlation between the proportion of Lithuanians and poverty level among boys under the age of 16 in the United States with a correlation coefficient (R) of 0.662 and weighted average of 14.0%. Similarly, the statistical analysis conducted on geographies consisting of 358,179,788 people shows a poor positive correlation between the proportion of Peruvians and poverty level among boys under the age of 16 in the United States with a correlation coefficient (R) of 0.174 and weighted average of 15.5%, a difference of 11.2%.
Lithuanian vs Peruvian Child Poverty Among Boys Under 16

Child Poverty Among Boys Under 16 Correlation Summary

MeasurementLithuanianPeruvian
Minimum7.6%1.4%
Maximum100.0%48.9%
Range92.4%47.5%
Mean26.4%17.6%
Median18.0%15.7%
Interquartile 25% (IQ1)11.5%12.6%
Interquartile 75% (IQ3)34.4%19.4%
Interquartile Range (IQR)22.9%6.8%
Standard Deviation (Sample)22.4%10.2%
Standard Deviation (Population)22.2%10.1%

Similar Demographics by Child Poverty Among Boys Under 16

Demographics Similar to Lithuanians by Child Poverty Among Boys Under 16

In terms of child poverty among boys under 16, the demographic groups most similar to Lithuanians are Korean (14.0%, a difference of 0.030%), Immigrants from Asia (13.9%, a difference of 0.090%), Immigrants from Australia (13.9%, a difference of 0.33%), Immigrants from Northern Europe (13.9%, a difference of 0.47%), and Croatian (14.0%, a difference of 0.53%).
DemographicsRating | RankChild Poverty Among Boys Under 16
Assyrians/Chaldeans/Syriacs
99.8
/100
|
#34
Exceptional
13.6%
Russians
99.7
/100
|
#35
Exceptional
13.8%
Luxembourgers
99.7
/100
|
#36
Exceptional
13.8%
Immigrants | Sri Lanka
99.6
/100
|
#37
Exceptional
13.9%
Immigrants | Northern Europe
99.6
/100
|
#38
Exceptional
13.9%
Immigrants | Australia
99.6
/100
|
#39
Exceptional
13.9%
Immigrants | Asia
99.6
/100
|
#40
Exceptional
13.9%
Lithuanians
99.6
/100
|
#41
Exceptional
14.0%
Koreans
99.6
/100
|
#42
Exceptional
14.0%
Croatians
99.5
/100
|
#43
Exceptional
14.0%
Estonians
99.4
/100
|
#44
Exceptional
14.1%
Immigrants | Scotland
99.4
/100
|
#45
Exceptional
14.1%
Greeks
99.4
/100
|
#46
Exceptional
14.1%
Immigrants | Moldova
99.4
/100
|
#47
Exceptional
14.1%
Immigrants | Indonesia
99.4
/100
|
#48
Exceptional
14.1%

Demographics Similar to Peruvians by Child Poverty Among Boys Under 16

In terms of child poverty among boys under 16, the demographic groups most similar to Peruvians are Welsh (15.5%, a difference of 0.040%), Immigrants from Kazakhstan (15.5%, a difference of 0.15%), Portuguese (15.5%, a difference of 0.17%), Icelander (15.5%, a difference of 0.19%), and Immigrants from Spain (15.6%, a difference of 0.29%).
DemographicsRating | RankChild Poverty Among Boys Under 16
Carpatho Rusyns
91.1
/100
|
#127
Exceptional
15.4%
Canadians
90.6
/100
|
#128
Exceptional
15.4%
Immigrants | Brazil
90.3
/100
|
#129
Exceptional
15.4%
Mongolians
90.2
/100
|
#130
Exceptional
15.4%
Immigrants | Western Europe
90.0
/100
|
#131
Exceptional
15.4%
Immigrants | Kazakhstan
88.7
/100
|
#132
Excellent
15.5%
Welsh
88.3
/100
|
#133
Excellent
15.5%
Peruvians
88.1
/100
|
#134
Excellent
15.5%
Portuguese
87.5
/100
|
#135
Excellent
15.5%
Icelanders
87.5
/100
|
#136
Excellent
15.5%
Immigrants | Spain
87.1
/100
|
#137
Excellent
15.6%
Immigrants | Southern Europe
86.5
/100
|
#138
Excellent
15.6%
Albanians
86.5
/100
|
#139
Excellent
15.6%
Immigrants | Kuwait
85.6
/100
|
#140
Excellent
15.6%
Slavs
84.5
/100
|
#141
Excellent
15.7%