Laotian vs Yugoslavian Child Poverty Among Boys Under 16
COMPARE
Laotian
Yugoslavian
Child Poverty Among Boys Under 16
Child Poverty Among Boys Under 16 Comparison
Laotians
Yugoslavians
14.3%
CHILD POVERTY AMONG BOYS UNDER 16
99.0/ 100
METRIC RATING
52nd/ 347
METRIC RANK
15.9%
CHILD POVERTY AMONG BOYS UNDER 16
75.9/ 100
METRIC RATING
158th/ 347
METRIC RANK
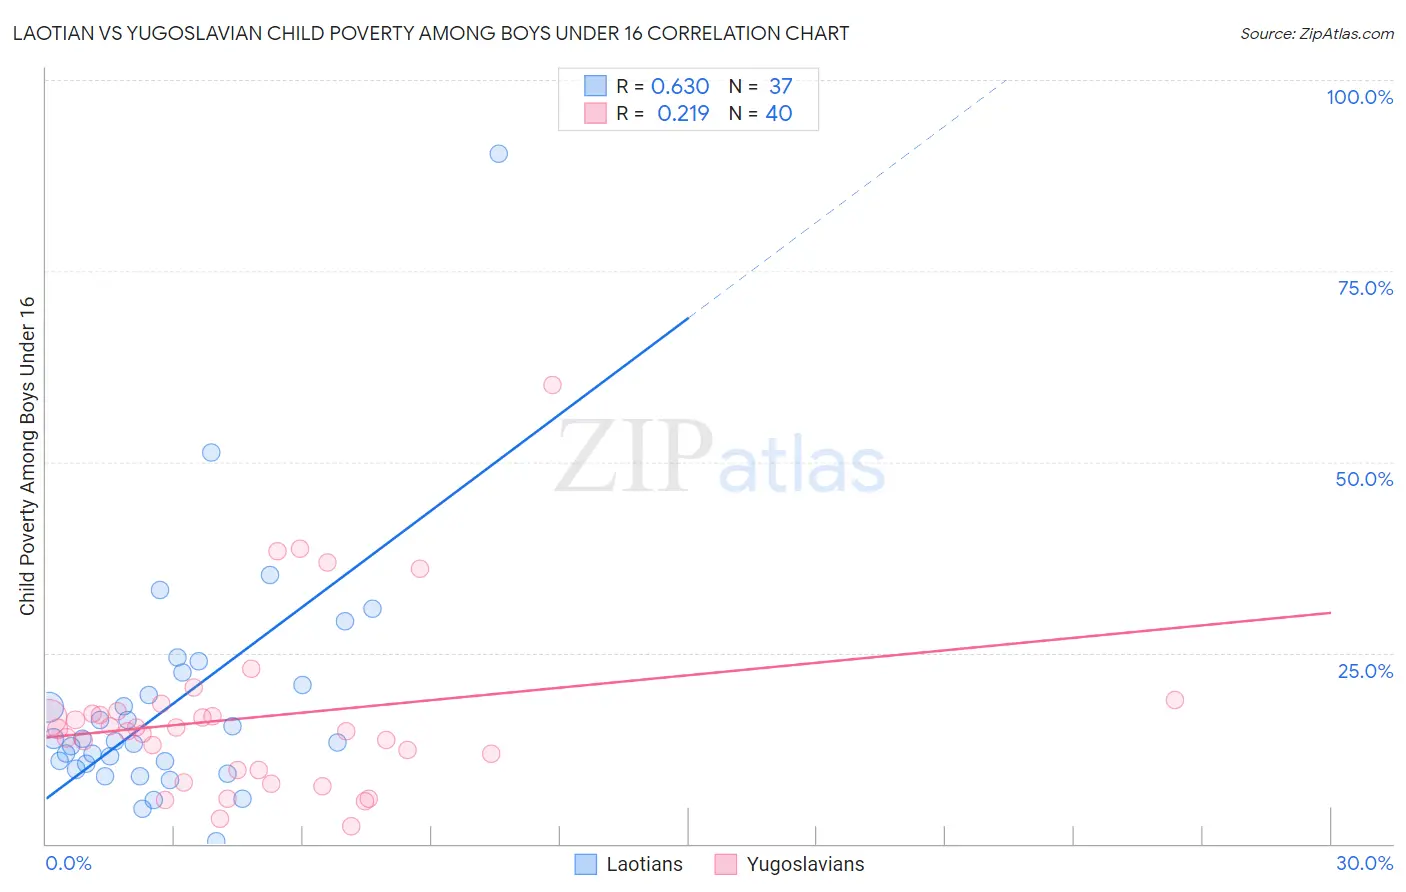
Laotian vs Yugoslavian Child Poverty Among Boys Under 16 Correlation Chart
The statistical analysis conducted on geographies consisting of 223,108,732 people shows a significant positive correlation between the proportion of Laotians and poverty level among boys under the age of 16 in the United States with a correlation coefficient (R) of 0.630 and weighted average of 14.3%. Similarly, the statistical analysis conducted on geographies consisting of 282,204,208 people shows a weak positive correlation between the proportion of Yugoslavians and poverty level among boys under the age of 16 in the United States with a correlation coefficient (R) of 0.219 and weighted average of 15.9%, a difference of 11.1%.
Child Poverty Among Boys Under 16 Correlation Summary
| Measurement | Laotian | Yugoslavian |
| Minimum | 0.40% | 2.4% |
| Maximum | 90.3% | 60.0% |
| Range | 89.9% | 57.6% |
| Mean | 18.2% | 16.6% |
| Median | 13.4% | 14.9% |
| Interquartile 25% (IQ1) | 10.1% | 9.7% |
| Interquartile 75% (IQ3) | 21.5% | 17.2% |
| Interquartile Range (IQR) | 11.4% | 7.5% |
| Standard Deviation (Sample) | 15.7% | 11.3% |
| Standard Deviation (Population) | 15.5% | 11.1% |
Similar Demographics by Child Poverty Among Boys Under 16
Demographics Similar to Laotians by Child Poverty Among Boys Under 16
In terms of child poverty among boys under 16, the demographic groups most similar to Laotians are Immigrants from Philippines (14.3%, a difference of 0.040%), Immigrants from Serbia (14.3%, a difference of 0.12%), Immigrants from Pakistan (14.3%, a difference of 0.17%), Zimbabwean (14.3%, a difference of 0.17%), and Polish (14.4%, a difference of 0.28%).
| Demographics | Rating | Rank | Child Poverty Among Boys Under 16 |
| Immigrants | Scotland | 99.4 /100 | #45 | Exceptional 14.1% |
| Greeks | 99.4 /100 | #46 | Exceptional 14.1% |
| Immigrants | Moldova | 99.4 /100 | #47 | Exceptional 14.1% |
| Immigrants | Indonesia | 99.4 /100 | #48 | Exceptional 14.1% |
| Czechs | 99.3 /100 | #49 | Exceptional 14.1% |
| Italians | 99.2 /100 | #50 | Exceptional 14.2% |
| Immigrants | Greece | 99.2 /100 | #51 | Exceptional 14.2% |
| Laotians | 99.0 /100 | #52 | Exceptional 14.3% |
| Immigrants | Philippines | 99.0 /100 | #53 | Exceptional 14.3% |
| Immigrants | Serbia | 99.0 /100 | #54 | Exceptional 14.3% |
| Immigrants | Pakistan | 99.0 /100 | #55 | Exceptional 14.3% |
| Zimbabweans | 99.0 /100 | #56 | Exceptional 14.3% |
| Poles | 98.9 /100 | #57 | Exceptional 14.4% |
| Immigrants | Sweden | 98.9 /100 | #58 | Exceptional 14.4% |
| Immigrants | Czechoslovakia | 98.9 /100 | #59 | Exceptional 14.4% |
Demographics Similar to Yugoslavians by Child Poverty Among Boys Under 16
In terms of child poverty among boys under 16, the demographic groups most similar to Yugoslavians are Immigrants from Nepal (15.9%, a difference of 0.010%), Israeli (15.9%, a difference of 0.10%), French Canadian (15.9%, a difference of 0.11%), Immigrants from Chile (15.9%, a difference of 0.17%), and Syrian (15.9%, a difference of 0.26%).
| Demographics | Rating | Rank | Child Poverty Among Boys Under 16 |
| Puget Sound Salish | 79.8 /100 | #151 | Good 15.8% |
| Immigrants | Venezuela | 79.5 /100 | #152 | Good 15.8% |
| French | 78.7 /100 | #153 | Good 15.8% |
| Syrians | 77.5 /100 | #154 | Good 15.9% |
| French Canadians | 76.6 /100 | #155 | Good 15.9% |
| Israelis | 76.5 /100 | #156 | Good 15.9% |
| Immigrants | Nepal | 76.0 /100 | #157 | Good 15.9% |
| Yugoslavians | 75.9 /100 | #158 | Good 15.9% |
| Immigrants | Chile | 74.8 /100 | #159 | Good 15.9% |
| Immigrants | Northern Africa | 71.3 /100 | #160 | Good 16.0% |
| Immigrants | Oceania | 71.3 /100 | #161 | Good 16.0% |
| Guamanians/Chamorros | 69.6 /100 | #162 | Good 16.1% |
| Costa Ricans | 68.1 /100 | #163 | Good 16.1% |
| Immigrants | Albania | 67.9 /100 | #164 | Good 16.1% |
| Colombians | 65.2 /100 | #165 | Good 16.1% |