Laotian vs Maltese Single Father Poverty

COMPARE

Laotian
Race
Ancestry
AfghanAfricanAlaska NativeAlaskan AthabascanAlbanianAleutAlsatianAmericanApacheArabArapahoArgentineanArmenianAssyrian/Chaldean/SyriacAustralianAustrianBahamianBangladeshiBarbadianBasqueBelgianBelizeanBermudanBhutaneseBlackfeetBolivianBrazilianBritishBritish West IndianBulgarianBurmeseCajunCambodianCanadianCape VerdeanCarpatho RusynCelticCentral AmericanCentral American IndianCherokeeCheyenneChickasawChileanChineseChippewaChoctawColombianColvilleComancheCosta RicanCreeCreekCroatianCrowCubanCypriotCzechCzechoslovakianDanishDelawareDominicanDutchDutch West IndianEastern EuropeanEcuadorianEgyptianEnglishEstonianEthiopianEuropeanFijianFilipinoFinnishFrenchFrench American IndianFrench CanadianGermanGerman RussianGhanaianGreekGuamanian/ChamorroGuatemalanGuyaneseHaitianHmongHonduranHopiHoumaHungarianIcelanderIndian (Asian)IndonesianInupiatIranianIraqiIrishIroquoisIsraeliItalianJamaicanJapaneseJordanianKenyanKiowaKoreanLaotianLatvianLebaneseLiberianLithuanianLumbeeLuxembourgerMacedonianMalaysianMarshalleseMenomineeMexicanMexican American IndianMongolianMoroccanNative HawaiianNavajoNepaleseNew ZealanderNicaraguanNigerianNorthern EuropeanNorwegianOkinawanOsageOttawaPaiutePakistaniPalestinianPanamanianParaguayanPennsylvania GermanPeruvianPimaPolishPortuguesePotawatomiPuebloPuerto RicanPuget Sound SalishRomanianRussianSalvadoranSamoanScandinavianScotch-IrishScottishSeminoleSenegaleseSerbianShoshoneSierra LeoneanSiouxSlavicSlovakSloveneSomaliSouth AfricanSouth AmericanSouth American IndianSoviet UnionSpaniardSpanishSpanish AmericanSpanish American IndianSri LankanSubsaharan AfricanSudaneseSwedishSwissSyrianTaiwaneseThaiTlingit-HaidaTohono O'OdhamTonganTrinidadian and TobagonianTsimshianTurkishU.S. Virgin IslanderUgandanUkrainianUruguayanUteVenezuelanVietnameseWelshWest IndianYakamaYaquiYugoslavianYumanYup'ikZimbabwean
Immigration
NonimmigrantsImmigrantsAfghanistanAfricaAlbaniaArgentinaArmeniaAsiaAustraliaAustriaBahamasBangladeshBarbadosBelarusBelgiumBelizeBoliviaBosnia and HerzegovinaBrazilBulgariaBurma/MyanmarCabo VerdeCambodiaCameroonCanadaCaribbeanCentral AmericaChileChinaColombiaCongoCosta RicaCroatiaCubaCzechoslovakiaDenmarkDominicaDominican RepublicEastern AfricaEastern AsiaEastern EuropeEcuadorEgyptEl SalvadorEnglandEritreaEthiopiaEuropeFijiFranceGermanyGhanaGreeceGrenadaGuatemalaGuyanaHaitiHondurasHong KongHungaryIndiaIndonesiaIranIraqIrelandIsraelItalyJamaicaJapanJordanKazakhstanKenyaKoreaKuwaitLaosLatin AmericaLatviaLebanonLiberiaLithuaniaMalaysiaMexicoMicronesiaMiddle AfricaMoldovaMoroccoNepalNetherlandsNicaraguaNigeriaNorth AmericaNorth MacedoniaNorthern AfricaNorthern EuropeNorwayOceaniaPakistanPanamaPeruPhilippinesPolandPortugalRomaniaRussiaSaudi ArabiaScotlandSenegalSerbiaSierra LeoneSingaporeSomaliaSouth AfricaSouth AmericaSouth Central AsiaSouth Eastern AsiaSouthern EuropeSpainSri LankaSt. Vincent and the GrenadinesSudanSwedenSwitzerlandSyriaTaiwanThailandTrinidad and TobagoTurkeyUgandaUkraineUruguayUzbekistanVenezuelaVietnamWest IndiesWestern AfricaWestern AsiaWestern EuropeYemenZaireZimbabweAzores
Maltese
Race
Ancestry
AfghanAfricanAlaska NativeAlaskan AthabascanAlbanianAleutAlsatianAmericanApacheArabArapahoArgentineanArmenianAssyrian/Chaldean/SyriacAustralianAustrianBahamianBangladeshiBarbadianBasqueBelgianBelizeanBermudanBhutaneseBlackfeetBolivianBrazilianBritishBritish West IndianBulgarianBurmeseCajunCambodianCanadianCape VerdeanCarpatho RusynCelticCentral AmericanCentral American IndianCherokeeCheyenneChickasawChileanChineseChippewaChoctawColombianColvilleComancheCosta RicanCreeCreekCroatianCrowCubanCypriotCzechCzechoslovakianDanishDelawareDominicanDutchDutch West IndianEastern EuropeanEcuadorianEgyptianEnglishEstonianEthiopianEuropeanFijianFilipinoFinnishFrenchFrench American IndianFrench CanadianGermanGerman RussianGhanaianGreekGuamanian/ChamorroGuatemalanGuyaneseHaitianHmongHonduranHopiHoumaHungarianIcelanderIndian (Asian)IndonesianInupiatIranianIraqiIrishIroquoisIsraeliItalianJamaicanJapaneseJordanianKenyanKiowaKoreanLatvianLebaneseLiberianLithuanianLumbeeLuxembourgerMacedonianMalaysianMalteseMarshalleseMenomineeMexicanMexican American IndianMongolianMoroccanNative HawaiianNavajoNepaleseNew ZealanderNicaraguanNigerianNorthern EuropeanNorwegianOkinawanOsageOttawaPaiutePakistaniPalestinianPanamanianParaguayanPennsylvania GermanPeruvianPimaPolishPortuguesePotawatomiPuebloPuerto RicanPuget Sound SalishRomanianRussianSalvadoranSamoanScandinavianScotch-IrishScottishSeminoleSenegaleseSerbianShoshoneSierra LeoneanSiouxSlavicSlovakSloveneSomaliSouth AfricanSouth AmericanSouth American IndianSoviet UnionSpaniardSpanishSpanish AmericanSpanish American IndianSri LankanSubsaharan AfricanSudaneseSwedishSwissSyrianTaiwaneseThaiTlingit-HaidaTohono O'OdhamTonganTrinidadian and TobagonianTsimshianTurkishU.S. Virgin IslanderUgandanUkrainianUruguayanUteVenezuelanVietnameseWelshWest IndianYakamaYaquiYugoslavianYumanYup'ikZimbabwean
Immigration
NonimmigrantsImmigrantsAfghanistanAfricaAlbaniaArgentinaArmeniaAsiaAustraliaAustriaBahamasBangladeshBarbadosBelarusBelgiumBelizeBoliviaBosnia and HerzegovinaBrazilBulgariaBurma/MyanmarCabo VerdeCambodiaCameroonCanadaCaribbeanCentral AmericaChileChinaColombiaCongoCosta RicaCroatiaCubaCzechoslovakiaDenmarkDominicaDominican RepublicEastern AfricaEastern AsiaEastern EuropeEcuadorEgyptEl SalvadorEnglandEritreaEthiopiaEuropeFijiFranceGermanyGhanaGreeceGrenadaGuatemalaGuyanaHaitiHondurasHong KongHungaryIndiaIndonesiaIranIraqIrelandIsraelItalyJamaicaJapanJordanKazakhstanKenyaKoreaKuwaitLaosLatin AmericaLatviaLebanonLiberiaLithuaniaMalaysiaMexicoMicronesiaMiddle AfricaMoldovaMoroccoNepalNetherlandsNicaraguaNigeriaNorth AmericaNorth MacedoniaNorthern AfricaNorthern EuropeNorwayOceaniaPakistanPanamaPeruPhilippinesPolandPortugalRomaniaRussiaSaudi ArabiaScotlandSenegalSerbiaSierra LeoneSingaporeSomaliaSouth AfricaSouth AmericaSouth Central AsiaSouth Eastern AsiaSouthern EuropeSpainSri LankaSt. Vincent and the GrenadinesSudanSwedenSwitzerlandSyriaTaiwanThailandTrinidad and TobagoTurkeyUgandaUkraineUruguayUzbekistanVenezuelaVietnamWest IndiesWestern AfricaWestern AsiaWestern EuropeYemenZaireZimbabweAzores
Single Father Poverty
Income
Poverty
Unemployment
Labor Participation
Family Structure
Vehicle Availability
Education Level
Disability

Single Father Poverty Comparison

Laotians

Maltese

Exceptional
Exceptional
15.1%
SINGLE FATHER POVERTY
99.9/ 100
METRIC RATING
57th/ 347
METRIC RANK
15.3%
SINGLE FATHER POVERTY
99.6/ 100
METRIC RATING
74th/ 347
METRIC RANK

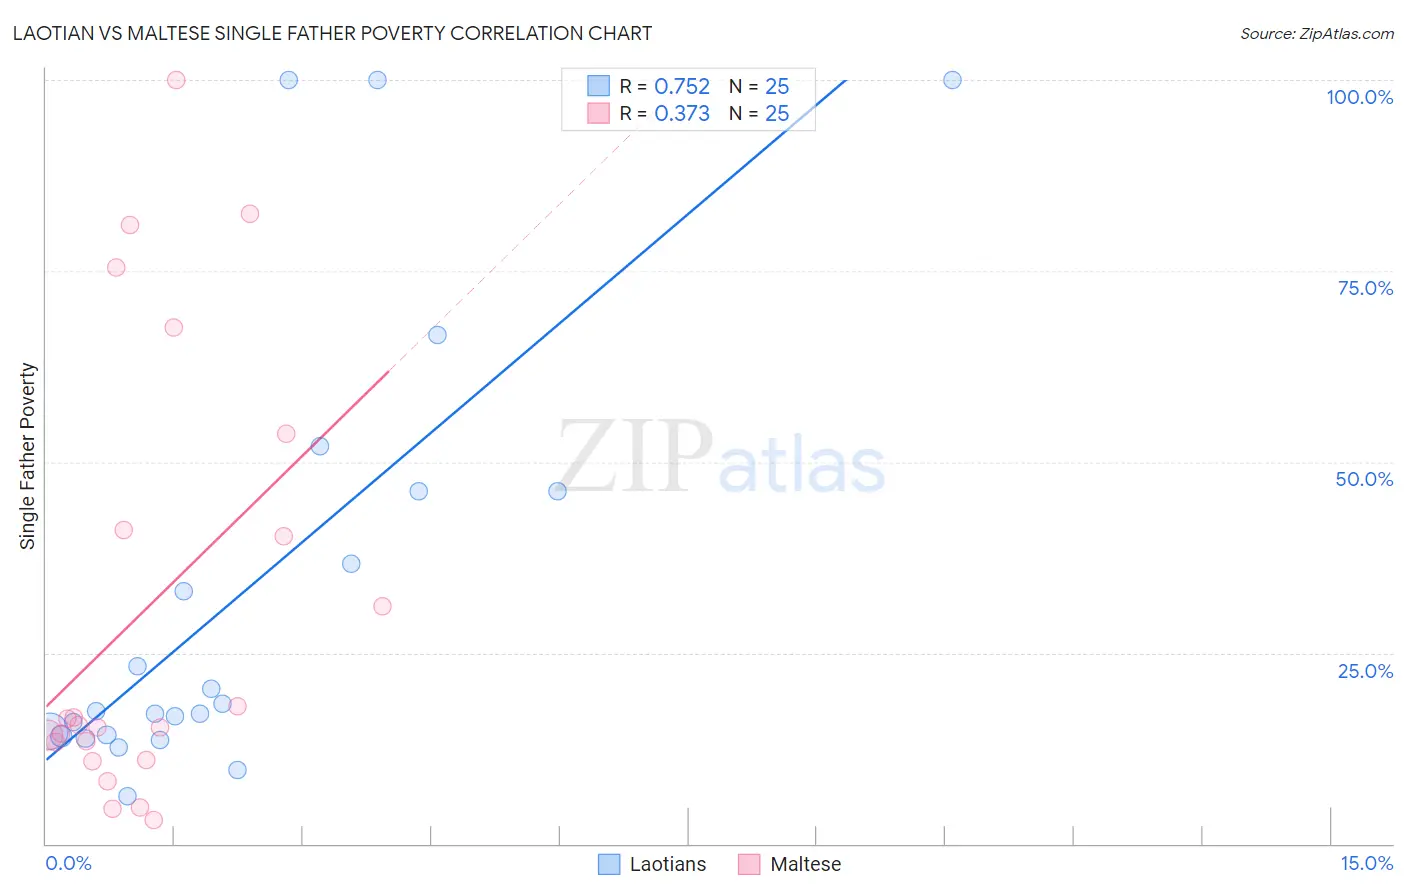
Laotian vs Maltese Single Father Poverty Correlation Chart

The statistical analysis conducted on geographies consisting of 189,346,173 people shows a strong positive correlation between the proportion of Laotians and poverty level among single fathers in the United States with a correlation coefficient (R) of 0.752 and weighted average of 15.1%. Similarly, the statistical analysis conducted on geographies consisting of 108,726,955 people shows a mild positive correlation between the proportion of Maltese and poverty level among single fathers in the United States with a correlation coefficient (R) of 0.373 and weighted average of 15.3%, a difference of 1.7%.
Laotian vs Maltese Single Father Poverty

Single Father Poverty Correlation Summary

MeasurementLaotianMaltese
Minimum6.3%3.0%
Maximum100.0%100.0%
Range93.7%97.0%
Mean33.0%30.7%
Median17.4%15.5%
Interquartile 25% (IQ1)14.1%12.2%
Interquartile 75% (IQ3)46.1%47.4%
Interquartile Range (IQR)32.0%35.3%
Standard Deviation (Sample)29.3%28.8%
Standard Deviation (Population)28.7%28.2%

Demographics Similar to Laotians and Maltese by Single Father Poverty

In terms of single father poverty, the demographic groups most similar to Laotians are Hawaiian (15.1%, a difference of 0.060%), Immigrants from Laos (15.1%, a difference of 0.090%), Guamanian/Chamorro (15.1%, a difference of 0.15%), Immigrants from Bulgaria (15.0%, a difference of 0.36%), and Puget Sound Salish (15.2%, a difference of 0.56%). Similarly, the demographic groups most similar to Maltese are Immigrants from Turkey (15.3%, a difference of 0.020%), Kenyan (15.3%, a difference of 0.040%), Immigrants from Lithuania (15.3%, a difference of 0.13%), Immigrants from Brazil (15.3%, a difference of 0.25%), and Mongolian (15.3%, a difference of 0.46%).
DemographicsRating | RankSingle Father Poverty
Immigrants | Bulgaria
99.9
/100
|
#55
Exceptional
15.0%
Immigrants | Laos
99.9
/100
|
#56
Exceptional
15.1%
Laotians
99.9
/100
|
#57
Exceptional
15.1%
Hawaiians
99.9
/100
|
#58
Exceptional
15.1%
Guamanians/Chamorros
99.9
/100
|
#59
Exceptional
15.1%
Puget Sound Salish
99.8
/100
|
#60
Exceptional
15.2%
Immigrants | Bosnia and Herzegovina
99.8
/100
|
#61
Exceptional
15.2%
Immigrants | Armenia
99.8
/100
|
#62
Exceptional
15.2%
Immigrants | Sweden
99.8
/100
|
#63
Exceptional
15.2%
Bangladeshis
99.8
/100
|
#64
Exceptional
15.2%
Immigrants | Malaysia
99.8
/100
|
#65
Exceptional
15.2%
Immigrants | Moldova
99.8
/100
|
#66
Exceptional
15.2%
Paraguayans
99.7
/100
|
#67
Exceptional
15.2%
Immigrants | Cameroon
99.7
/100
|
#68
Exceptional
15.2%
Japanese
99.7
/100
|
#69
Exceptional
15.2%
Mongolians
99.7
/100
|
#70
Exceptional
15.3%
Immigrants | Brazil
99.6
/100
|
#71
Exceptional
15.3%
Immigrants | Lithuania
99.6
/100
|
#72
Exceptional
15.3%
Kenyans
99.6
/100
|
#73
Exceptional
15.3%
Maltese
99.6
/100
|
#74
Exceptional
15.3%
Immigrants | Turkey
99.5
/100
|
#75
Exceptional
15.3%