Kiowa vs Immigrants from Haiti Single Mother Poverty

COMPARE

Kiowa
Race
Ancestry
AfghanAfricanAlaska NativeAlaskan AthabascanAlbanianAleutAlsatianAmericanApacheArabArapahoArgentineanArmenianAssyrian/Chaldean/SyriacAustralianAustrianBahamianBangladeshiBarbadianBasqueBelgianBelizeanBermudanBhutaneseBlackfeetBolivianBrazilianBritishBritish West IndianBulgarianBurmeseCajunCambodianCanadianCape VerdeanCarpatho RusynCelticCentral AmericanCentral American IndianCherokeeCheyenneChickasawChileanChineseChippewaChoctawColombianColvilleComancheCosta RicanCreeCreekCroatianCrowCubanCypriotCzechCzechoslovakianDanishDelawareDominicanDutchDutch West IndianEastern EuropeanEcuadorianEgyptianEnglishEstonianEthiopianEuropeanFijianFilipinoFinnishFrenchFrench American IndianFrench CanadianGermanGerman RussianGhanaianGreekGuamanian/ChamorroGuatemalanGuyaneseHaitianHmongHonduranHopiHoumaHungarianIcelanderIndian (Asian)IndonesianInupiatIranianIraqiIrishIroquoisIsraeliItalianJamaicanJapaneseJordanianKenyanKiowaKoreanLaotianLatvianLebaneseLiberianLithuanianLumbeeLuxembourgerMacedonianMalaysianMalteseMarshalleseMenomineeMexicanMexican American IndianMongolianMoroccanNative HawaiianNavajoNepaleseNew ZealanderNicaraguanNigerianNorthern EuropeanNorwegianOkinawanOsageOttawaPaiutePakistaniPalestinianPanamanianParaguayanPennsylvania GermanPeruvianPimaPolishPortuguesePotawatomiPuebloPuerto RicanPuget Sound SalishRomanianRussianSalvadoranSamoanScandinavianScotch-IrishScottishSeminoleSenegaleseSerbianShoshoneSierra LeoneanSiouxSlavicSlovakSloveneSomaliSouth AfricanSouth AmericanSouth American IndianSoviet UnionSpaniardSpanishSpanish AmericanSpanish American IndianSri LankanSubsaharan AfricanSudaneseSwedishSwissSyrianTaiwaneseThaiTlingit-HaidaTohono O'OdhamTonganTrinidadian and TobagonianTsimshianTurkishU.S. Virgin IslanderUgandanUkrainianUruguayanUteVenezuelanVietnameseWelshWest IndianYakamaYaquiYugoslavianYumanYup'ikZimbabwean
Immigration
NonimmigrantsImmigrantsAfghanistanAfricaAlbaniaArgentinaArmeniaAsiaAustraliaAustriaBahamasBangladeshBarbadosBelarusBelgiumBelizeBoliviaBosnia and HerzegovinaBrazilBulgariaBurma/MyanmarCabo VerdeCambodiaCameroonCanadaCaribbeanCentral AmericaChileChinaColombiaCongoCosta RicaCroatiaCubaCzechoslovakiaDenmarkDominicaDominican RepublicEastern AfricaEastern AsiaEastern EuropeEcuadorEgyptEl SalvadorEnglandEritreaEthiopiaEuropeFijiFranceGermanyGhanaGreeceGrenadaGuatemalaGuyanaHondurasHong KongHungaryIndiaIndonesiaIranIraqIrelandIsraelItalyJamaicaJapanJordanKazakhstanKenyaKoreaKuwaitLaosLatin AmericaLatviaLebanonLiberiaLithuaniaMalaysiaMexicoMicronesiaMiddle AfricaMoldovaMoroccoNepalNetherlandsNicaraguaNigeriaNorth AmericaNorth MacedoniaNorthern AfricaNorthern EuropeNorwayOceaniaPakistanPanamaPeruPhilippinesPolandPortugalRomaniaRussiaSaudi ArabiaScotlandSenegalSerbiaSierra LeoneSingaporeSomaliaSouth AfricaSouth AmericaSouth Central AsiaSouth Eastern AsiaSouthern EuropeSpainSri LankaSt. Vincent and the GrenadinesSudanSwedenSwitzerlandSyriaTaiwanThailandTrinidad and TobagoTurkeyUgandaUkraineUruguayUzbekistanVenezuelaVietnamWest IndiesWestern AfricaWestern AsiaWestern EuropeYemenZaireZimbabweAzores
Immigrants from Haiti
Race
Ancestry
AfghanAfricanAlaska NativeAlaskan AthabascanAlbanianAleutAlsatianAmericanApacheArabArapahoArgentineanArmenianAssyrian/Chaldean/SyriacAustralianAustrianBahamianBangladeshiBarbadianBasqueBelgianBelizeanBermudanBhutaneseBlackfeetBolivianBrazilianBritishBritish West IndianBulgarianBurmeseCajunCambodianCanadianCape VerdeanCarpatho RusynCelticCentral AmericanCentral American IndianCherokeeCheyenneChickasawChileanChineseChippewaChoctawColombianColvilleComancheCosta RicanCreeCreekCroatianCrowCubanCypriotCzechCzechoslovakianDanishDelawareDominicanDutchDutch West IndianEastern EuropeanEcuadorianEgyptianEnglishEstonianEthiopianEuropeanFijianFilipinoFinnishFrenchFrench American IndianFrench CanadianGermanGerman RussianGhanaianGreekGuamanian/ChamorroGuatemalanGuyaneseHaitianHmongHonduranHopiHoumaHungarianIcelanderIndian (Asian)IndonesianInupiatIranianIraqiIrishIroquoisIsraeliItalianJamaicanJapaneseJordanianKenyanKoreanLaotianLatvianLebaneseLiberianLithuanianLumbeeLuxembourgerMacedonianMalaysianMalteseMarshalleseMenomineeMexicanMexican American IndianMongolianMoroccanNative HawaiianNavajoNepaleseNew ZealanderNicaraguanNigerianNorthern EuropeanNorwegianOkinawanOsageOttawaPaiutePakistaniPalestinianPanamanianParaguayanPennsylvania GermanPeruvianPimaPolishPortuguesePotawatomiPuebloPuerto RicanPuget Sound SalishRomanianRussianSalvadoranSamoanScandinavianScotch-IrishScottishSeminoleSenegaleseSerbianShoshoneSierra LeoneanSiouxSlavicSlovakSloveneSomaliSouth AfricanSouth AmericanSouth American IndianSoviet UnionSpaniardSpanishSpanish AmericanSpanish American IndianSri LankanSubsaharan AfricanSudaneseSwedishSwissSyrianTaiwaneseThaiTlingit-HaidaTohono O'OdhamTonganTrinidadian and TobagonianTsimshianTurkishU.S. Virgin IslanderUgandanUkrainianUruguayanUteVenezuelanVietnameseWelshWest IndianYakamaYaquiYugoslavianYumanYup'ikZimbabwean
Immigration
NonimmigrantsImmigrantsAfghanistanAfricaAlbaniaArgentinaArmeniaAsiaAustraliaAustriaBahamasBangladeshBarbadosBelarusBelgiumBelizeBoliviaBosnia and HerzegovinaBrazilBulgariaBurma/MyanmarCabo VerdeCambodiaCameroonCanadaCaribbeanCentral AmericaChileChinaColombiaCongoCosta RicaCroatiaCubaCzechoslovakiaDenmarkDominicaDominican RepublicEastern AfricaEastern AsiaEastern EuropeEcuadorEgyptEl SalvadorEnglandEritreaEthiopiaEuropeFijiFranceGermanyGhanaGreeceGrenadaGuatemalaGuyanaHaitiHondurasHong KongHungaryIndiaIndonesiaIranIraqIrelandIsraelItalyJamaicaJapanJordanKazakhstanKenyaKoreaKuwaitLaosLatin AmericaLatviaLebanonLiberiaLithuaniaMalaysiaMexicoMicronesiaMiddle AfricaMoldovaMoroccoNepalNetherlandsNicaraguaNigeriaNorth AmericaNorth MacedoniaNorthern AfricaNorthern EuropeNorwayOceaniaPakistanPanamaPeruPhilippinesPolandPortugalRomaniaRussiaSaudi ArabiaScotlandSenegalSerbiaSierra LeoneSingaporeSomaliaSouth AfricaSouth AmericaSouth Central AsiaSouth Eastern AsiaSouthern EuropeSpainSri LankaSt. Vincent and the GrenadinesSudanSwedenSwitzerlandSyriaTaiwanThailandTrinidad and TobagoTurkeyUgandaUkraineUruguayUzbekistanVenezuelaVietnamWest IndiesWestern AfricaWestern AsiaWestern EuropeYemenZaireZimbabweAzores
Single Mother Poverty
Income
Poverty
Unemployment
Labor Participation
Family Structure
Vehicle Availability
Education Level
Disability

Single Mother Poverty Comparison

Kiowa

Immigrants from Haiti

Tragic
Poor
35.5%
SINGLE MOTHER POVERTY
0.0/ 100
METRIC RATING
323rd/ 347
METRIC RANK
29.7%
SINGLE MOTHER POVERTY
15.8/ 100
METRIC RATING
206th/ 347
METRIC RANK

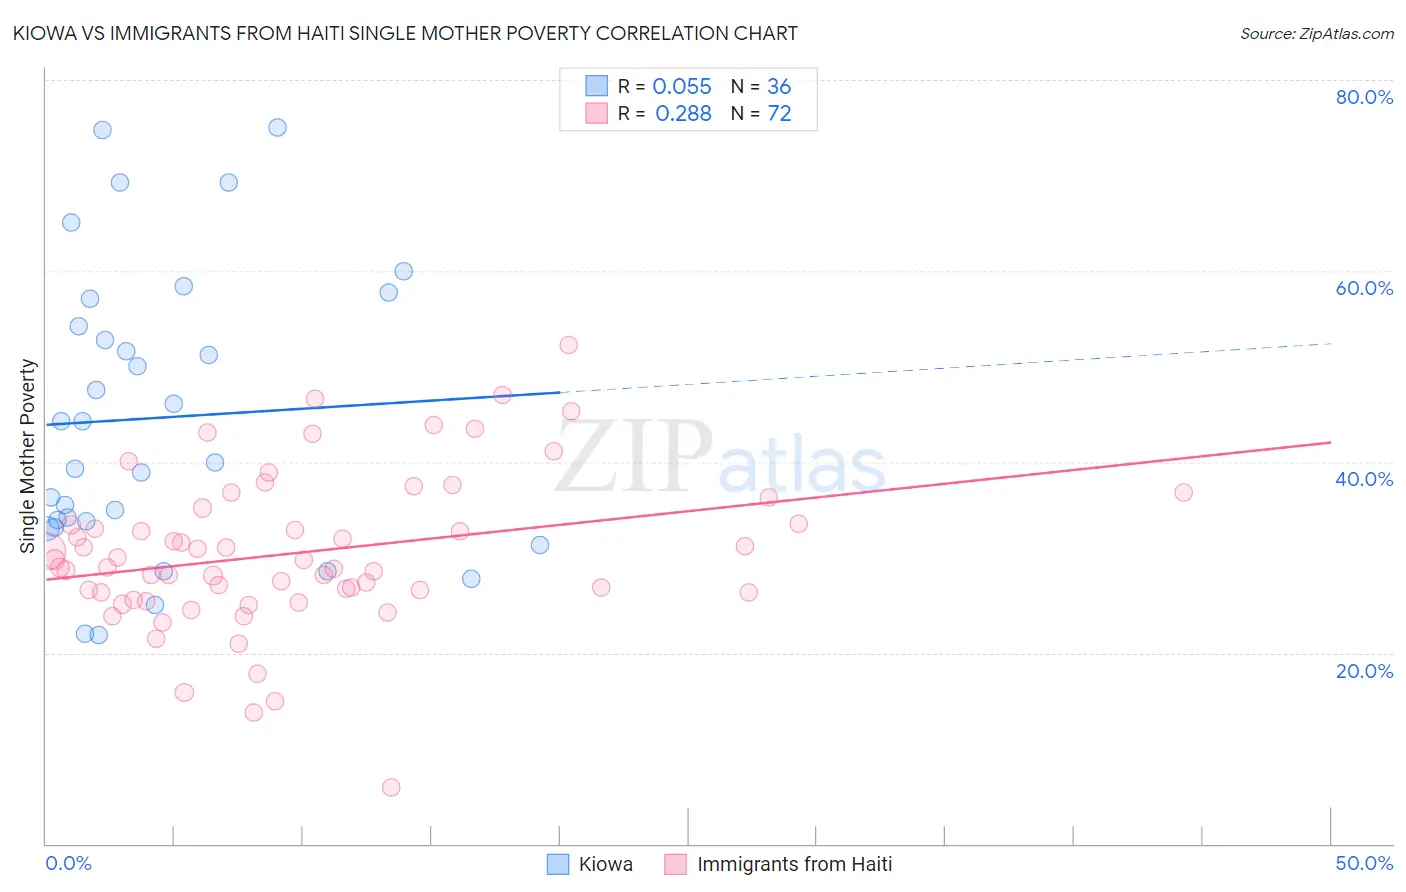
Kiowa vs Immigrants from Haiti Single Mother Poverty Correlation Chart

The statistical analysis conducted on geographies consisting of 55,943,976 people shows a slight positive correlation between the proportion of Kiowa and poverty level among single mothers in the United States with a correlation coefficient (R) of 0.055 and weighted average of 35.5%. Similarly, the statistical analysis conducted on geographies consisting of 221,600,908 people shows a weak positive correlation between the proportion of Immigrants from Haiti and poverty level among single mothers in the United States with a correlation coefficient (R) of 0.288 and weighted average of 29.7%, a difference of 19.2%.
Kiowa vs Immigrants from Haiti Single Mother Poverty

Single Mother Poverty Correlation Summary

MeasurementKiowaImmigrants from Haiti
Minimum21.9%5.9%
Maximum75.0%52.2%
Range53.1%46.3%
Mean44.6%30.5%
Median42.1%29.3%
Interquartile 25% (IQ1)33.5%26.3%
Interquartile 75% (IQ3)55.7%34.3%
Interquartile Range (IQR)22.2%8.0%
Standard Deviation (Sample)15.0%8.1%
Standard Deviation (Population)14.7%8.1%

Similar Demographics by Single Mother Poverty

Demographics Similar to Kiowa by Single Mother Poverty

In terms of single mother poverty, the demographic groups most similar to Kiowa are Ottawa (35.5%, a difference of 0.21%), Ute (35.7%, a difference of 0.69%), Black/African American (35.2%, a difference of 0.71%), Paiute (35.1%, a difference of 0.91%), and Seminole (35.8%, a difference of 0.99%).
DemographicsRating | RankSingle Mother Poverty
Dominicans
0.0
/100
|
#316
Tragic
34.5%
Cherokee
0.0
/100
|
#317
Tragic
34.5%
Immigrants | Honduras
0.0
/100
|
#318
Tragic
34.7%
Chippewa
0.0
/100
|
#319
Tragic
34.8%
Iroquois
0.0
/100
|
#320
Tragic
34.8%
Paiute
0.0
/100
|
#321
Tragic
35.1%
Blacks/African Americans
0.0
/100
|
#322
Tragic
35.2%
Kiowa
0.0
/100
|
#323
Tragic
35.5%
Ottawa
0.0
/100
|
#324
Tragic
35.5%
Ute
0.0
/100
|
#325
Tragic
35.7%
Seminole
0.0
/100
|
#326
Tragic
35.8%
Yakama
0.0
/100
|
#327
Tragic
36.4%
Choctaw
0.0
/100
|
#328
Tragic
36.4%
Apache
0.0
/100
|
#329
Tragic
36.6%
Natives/Alaskans
0.0
/100
|
#330
Tragic
36.6%

Demographics Similar to Immigrants from Haiti by Single Mother Poverty

In terms of single mother poverty, the demographic groups most similar to Immigrants from Haiti are Czechoslovakian (29.7%, a difference of 0.020%), Immigrants from Panama (29.8%, a difference of 0.030%), Immigrants (29.7%, a difference of 0.060%), Immigrants from Guyana (29.8%, a difference of 0.10%), and Swiss (29.7%, a difference of 0.12%).
DemographicsRating | RankSingle Mother Poverty
Cubans
20.8
/100
|
#199
Fair
29.6%
Panamanians
20.0
/100
|
#200
Fair
29.6%
Belgians
18.8
/100
|
#201
Poor
29.7%
Malaysians
17.4
/100
|
#202
Poor
29.7%
Swiss
17.2
/100
|
#203
Poor
29.7%
Immigrants | Immigrants
16.6
/100
|
#204
Poor
29.7%
Czechoslovakians
16.1
/100
|
#205
Poor
29.7%
Immigrants | Haiti
15.8
/100
|
#206
Poor
29.7%
Immigrants | Panama
15.5
/100
|
#207
Poor
29.8%
Immigrants | Guyana
14.7
/100
|
#208
Poor
29.8%
Irish
13.9
/100
|
#209
Poor
29.8%
Haitians
13.3
/100
|
#210
Poor
29.8%
Guyanese
12.8
/100
|
#211
Poor
29.8%
Nicaraguans
12.4
/100
|
#212
Poor
29.8%
Immigrants | Thailand
12.0
/100
|
#213
Poor
29.9%