Kiowa vs Hmong Female Poverty Among 25-34 Year Olds
COMPARE
Kiowa
Hmong
Female Poverty Among 25-34 Year Olds
Female Poverty Among 25-34 Year Olds Comparison
Kiowa
Hmong
19.7%
FEMALE POVERTY AMONG 25-34 YEAR OLDS
0.0/ 100
METRIC RATING
331st/ 347
METRIC RANK
13.9%
FEMALE POVERTY AMONG 25-34 YEAR OLDS
20.3/ 100
METRIC RATING
200th/ 347
METRIC RANK
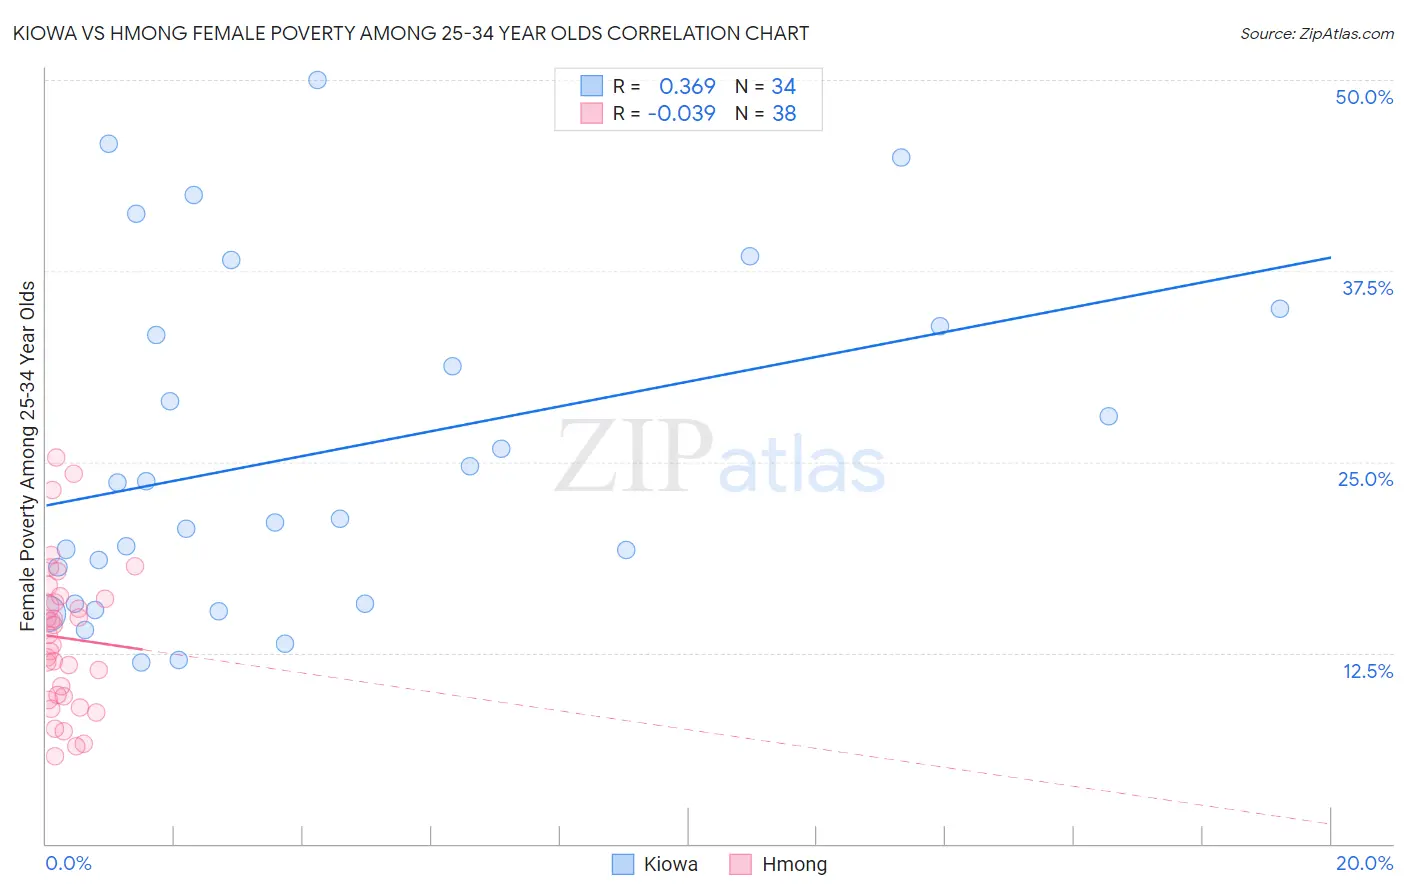
Kiowa vs Hmong Female Poverty Among 25-34 Year Olds Correlation Chart
The statistical analysis conducted on geographies consisting of 56,020,339 people shows a mild positive correlation between the proportion of Kiowa and poverty level among females between the ages 25 and 34 in the United States with a correlation coefficient (R) of 0.369 and weighted average of 19.7%. Similarly, the statistical analysis conducted on geographies consisting of 24,665,779 people shows no correlation between the proportion of Hmong and poverty level among females between the ages 25 and 34 in the United States with a correlation coefficient (R) of -0.039 and weighted average of 13.9%, a difference of 41.3%.
Female Poverty Among 25-34 Year Olds Correlation Summary
| Measurement | Kiowa | Hmong |
| Minimum | 11.9% | 5.8% |
| Maximum | 50.0% | 25.3% |
| Range | 38.1% | 19.5% |
| Mean | 25.7% | 13.5% |
| Median | 22.5% | 13.3% |
| Interquartile 25% (IQ1) | 15.7% | 9.6% |
| Interquartile 75% (IQ3) | 33.8% | 16.0% |
| Interquartile Range (IQR) | 18.1% | 6.4% |
| Standard Deviation (Sample) | 11.0% | 4.8% |
| Standard Deviation (Population) | 10.8% | 4.7% |
Similar Demographics by Female Poverty Among 25-34 Year Olds
Demographics Similar to Kiowa by Female Poverty Among 25-34 Year Olds
In terms of female poverty among 25-34 year olds, the demographic groups most similar to Kiowa are Paiute (19.6%, a difference of 0.42%), Immigrants from Yemen (19.8%, a difference of 0.59%), Cajun (19.9%, a difference of 1.4%), Apache (20.1%, a difference of 2.1%), and Creek (19.2%, a difference of 2.7%).
| Demographics | Rating | Rank | Female Poverty Among 25-34 Year Olds |
| Dutch West Indians | 0.0 /100 | #324 | Tragic 18.4% |
| Inupiat | 0.0 /100 | #325 | Tragic 18.5% |
| Blacks/African Americans | 0.0 /100 | #326 | Tragic 18.9% |
| Cheyenne | 0.0 /100 | #327 | Tragic 19.1% |
| Alaskan Athabascans | 0.0 /100 | #328 | Tragic 19.1% |
| Creek | 0.0 /100 | #329 | Tragic 19.2% |
| Paiute | 0.0 /100 | #330 | Tragic 19.6% |
| Kiowa | 0.0 /100 | #331 | Tragic 19.7% |
| Immigrants | Yemen | 0.0 /100 | #332 | Tragic 19.8% |
| Cajuns | 0.0 /100 | #333 | Tragic 19.9% |
| Apache | 0.0 /100 | #334 | Tragic 20.1% |
| Natives/Alaskans | 0.0 /100 | #335 | Tragic 20.3% |
| Pueblo | 0.0 /100 | #336 | Tragic 22.2% |
| Crow | 0.0 /100 | #337 | Tragic 22.7% |
| Houma | 0.0 /100 | #338 | Tragic 22.7% |
Demographics Similar to Hmong by Female Poverty Among 25-34 Year Olds
In terms of female poverty among 25-34 year olds, the demographic groups most similar to Hmong are English (13.9%, a difference of 0.020%), Immigrants from Germany (13.9%, a difference of 0.080%), Immigrants from Saudi Arabia (13.9%, a difference of 0.19%), Immigrants from Trinidad and Tobago (14.0%, a difference of 0.35%), and Scottish (13.9%, a difference of 0.39%).
| Demographics | Rating | Rank | Female Poverty Among 25-34 Year Olds |
| Immigrants | Kenya | 28.0 /100 | #193 | Fair 13.8% |
| Moroccans | 25.1 /100 | #194 | Fair 13.8% |
| Immigrants | Cambodia | 24.0 /100 | #195 | Fair 13.9% |
| Scottish | 23.6 /100 | #196 | Fair 13.9% |
| Immigrants | Saudi Arabia | 21.9 /100 | #197 | Fair 13.9% |
| Immigrants | Germany | 20.9 /100 | #198 | Fair 13.9% |
| English | 20.4 /100 | #199 | Fair 13.9% |
| Hmong | 20.3 /100 | #200 | Fair 13.9% |
| Immigrants | Trinidad and Tobago | 17.6 /100 | #201 | Poor 14.0% |
| Welsh | 17.2 /100 | #202 | Poor 14.0% |
| Immigrants | Immigrants | 14.5 /100 | #203 | Poor 14.0% |
| Hawaiians | 13.6 /100 | #204 | Poor 14.1% |
| Immigrants | Africa | 13.4 /100 | #205 | Poor 14.1% |
| Hungarians | 11.8 /100 | #206 | Poor 14.1% |
| Japanese | 11.7 /100 | #207 | Poor 14.1% |