Kenyan vs Immigrants from Eastern Europe Family Poverty

COMPARE

Kenyan
Race
Ancestry
AfghanAfricanAlaska NativeAlaskan AthabascanAlbanianAleutAlsatianAmericanApacheArabArapahoArgentineanArmenianAssyrian/Chaldean/SyriacAustralianAustrianBahamianBangladeshiBarbadianBasqueBelgianBelizeanBermudanBhutaneseBlackfeetBolivianBrazilianBritishBritish West IndianBulgarianBurmeseCajunCambodianCanadianCape VerdeanCarpatho RusynCelticCentral AmericanCentral American IndianCherokeeCheyenneChickasawChileanChineseChippewaChoctawColombianColvilleComancheCosta RicanCreeCreekCroatianCrowCubanCypriotCzechCzechoslovakianDanishDelawareDominicanDutchDutch West IndianEastern EuropeanEcuadorianEgyptianEnglishEstonianEthiopianEuropeanFijianFilipinoFinnishFrenchFrench American IndianFrench CanadianGermanGerman RussianGhanaianGreekGuamanian/ChamorroGuatemalanGuyaneseHaitianHmongHonduranHopiHoumaHungarianIcelanderIndian (Asian)IndonesianInupiatIranianIraqiIrishIroquoisIsraeliItalianJamaicanJapaneseJordanianKenyanKiowaKoreanLaotianLatvianLebaneseLiberianLithuanianLumbeeLuxembourgerMacedonianMalaysianMalteseMarshalleseMenomineeMexicanMexican American IndianMongolianMoroccanNative HawaiianNavajoNepaleseNew ZealanderNicaraguanNigerianNorthern EuropeanNorwegianOkinawanOsageOttawaPaiutePakistaniPalestinianPanamanianParaguayanPennsylvania GermanPeruvianPimaPolishPortuguesePotawatomiPuebloPuerto RicanPuget Sound SalishRomanianRussianSalvadoranSamoanScandinavianScotch-IrishScottishSeminoleSenegaleseSerbianShoshoneSierra LeoneanSiouxSlavicSlovakSloveneSomaliSouth AfricanSouth AmericanSouth American IndianSoviet UnionSpaniardSpanishSpanish AmericanSpanish American IndianSri LankanSubsaharan AfricanSudaneseSwedishSwissSyrianTaiwaneseThaiTlingit-HaidaTohono O'OdhamTonganTrinidadian and TobagonianTsimshianTurkishU.S. Virgin IslanderUgandanUkrainianUruguayanUteVenezuelanVietnameseWelshWest IndianYakamaYaquiYugoslavianYumanYup'ikZimbabwean
Immigration
NonimmigrantsImmigrantsAfghanistanAfricaAlbaniaArgentinaArmeniaAsiaAustraliaAustriaBahamasBangladeshBarbadosBelarusBelgiumBelizeBoliviaBosnia and HerzegovinaBrazilBulgariaBurma/MyanmarCabo VerdeCambodiaCameroonCanadaCaribbeanCentral AmericaChileChinaColombiaCongoCosta RicaCroatiaCubaCzechoslovakiaDenmarkDominicaDominican RepublicEastern AfricaEastern AsiaEcuadorEgyptEl SalvadorEnglandEritreaEthiopiaEuropeFijiFranceGermanyGhanaGreeceGrenadaGuatemalaGuyanaHaitiHondurasHong KongHungaryIndiaIndonesiaIranIraqIrelandIsraelItalyJamaicaJapanJordanKazakhstanKenyaKoreaKuwaitLaosLatin AmericaLatviaLebanonLiberiaLithuaniaMalaysiaMexicoMicronesiaMiddle AfricaMoldovaMoroccoNepalNetherlandsNicaraguaNigeriaNorth AmericaNorth MacedoniaNorthern AfricaNorthern EuropeNorwayOceaniaPakistanPanamaPeruPhilippinesPolandPortugalRomaniaRussiaSaudi ArabiaScotlandSenegalSerbiaSierra LeoneSingaporeSomaliaSouth AfricaSouth AmericaSouth Central AsiaSouth Eastern AsiaSouthern EuropeSpainSri LankaSt. Vincent and the GrenadinesSudanSwedenSwitzerlandSyriaTaiwanThailandTrinidad and TobagoTurkeyUgandaUkraineUruguayUzbekistanVenezuelaVietnamWest IndiesWestern AfricaWestern AsiaWestern EuropeYemenZaireZimbabweAzores
Immigrants from Eastern Europe
Race
Ancestry
AfghanAfricanAlaska NativeAlaskan AthabascanAlbanianAleutAlsatianAmericanApacheArabArapahoArgentineanArmenianAssyrian/Chaldean/SyriacAustralianAustrianBahamianBangladeshiBarbadianBasqueBelgianBelizeanBermudanBhutaneseBlackfeetBolivianBrazilianBritishBritish West IndianBulgarianBurmeseCajunCambodianCanadianCape VerdeanCarpatho RusynCelticCentral AmericanCentral American IndianCherokeeCheyenneChickasawChileanChineseChippewaChoctawColombianColvilleComancheCosta RicanCreeCreekCroatianCrowCubanCypriotCzechCzechoslovakianDanishDelawareDominicanDutchDutch West IndianEastern EuropeanEcuadorianEgyptianEnglishEstonianEthiopianEuropeanFijianFilipinoFinnishFrenchFrench American IndianFrench CanadianGermanGerman RussianGhanaianGreekGuamanian/ChamorroGuatemalanGuyaneseHaitianHmongHonduranHopiHoumaHungarianIcelanderIndian (Asian)IndonesianInupiatIranianIraqiIrishIroquoisIsraeliItalianJamaicanJapaneseJordanianKiowaKoreanLaotianLatvianLebaneseLiberianLithuanianLumbeeLuxembourgerMacedonianMalaysianMalteseMarshalleseMenomineeMexicanMexican American IndianMongolianMoroccanNative HawaiianNavajoNepaleseNew ZealanderNicaraguanNigerianNorthern EuropeanNorwegianOkinawanOsageOttawaPaiutePakistaniPalestinianPanamanianParaguayanPennsylvania GermanPeruvianPimaPolishPortuguesePotawatomiPuebloPuerto RicanPuget Sound SalishRomanianRussianSalvadoranSamoanScandinavianScotch-IrishScottishSeminoleSenegaleseSerbianShoshoneSierra LeoneanSiouxSlavicSlovakSloveneSomaliSouth AfricanSouth AmericanSouth American IndianSoviet UnionSpaniardSpanishSpanish AmericanSpanish American IndianSri LankanSubsaharan AfricanSudaneseSwedishSwissSyrianTaiwaneseThaiTlingit-HaidaTohono O'OdhamTonganTrinidadian and TobagonianTsimshianTurkishU.S. Virgin IslanderUgandanUkrainianUruguayanUteVenezuelanVietnameseWelshWest IndianYakamaYaquiYugoslavianYumanYup'ikZimbabwean
Immigration
NonimmigrantsImmigrantsAfghanistanAfricaAlbaniaArgentinaArmeniaAsiaAustraliaAustriaBahamasBangladeshBarbadosBelarusBelgiumBelizeBoliviaBosnia and HerzegovinaBrazilBulgariaBurma/MyanmarCabo VerdeCambodiaCameroonCanadaCaribbeanCentral AmericaChileChinaColombiaCongoCosta RicaCroatiaCubaCzechoslovakiaDenmarkDominicaDominican RepublicEastern AfricaEastern AsiaEastern EuropeEcuadorEgyptEl SalvadorEnglandEritreaEthiopiaEuropeFijiFranceGermanyGhanaGreeceGrenadaGuatemalaGuyanaHaitiHondurasHong KongHungaryIndiaIndonesiaIranIraqIrelandIsraelItalyJamaicaJapanJordanKazakhstanKenyaKoreaKuwaitLaosLatin AmericaLatviaLebanonLiberiaLithuaniaMalaysiaMexicoMicronesiaMiddle AfricaMoldovaMoroccoNepalNetherlandsNicaraguaNigeriaNorth AmericaNorth MacedoniaNorthern AfricaNorthern EuropeNorwayOceaniaPakistanPanamaPeruPhilippinesPolandPortugalRomaniaRussiaSaudi ArabiaScotlandSenegalSerbiaSierra LeoneSingaporeSomaliaSouth AfricaSouth AmericaSouth Central AsiaSouth Eastern AsiaSouthern EuropeSpainSri LankaSt. Vincent and the GrenadinesSudanSwedenSwitzerlandSyriaTaiwanThailandTrinidad and TobagoTurkeyUgandaUkraineUruguayUzbekistanVenezuelaVietnamWest IndiesWestern AfricaWestern AsiaWestern EuropeYemenZaireZimbabweAzores
Family Poverty
Income
Poverty
Unemployment
Labor Participation
Family Structure
Vehicle Availability
Education Level
Disability

Family Poverty Comparison

Kenyans

Immigrants from Eastern Europe

Average
Exceptional
8.9%
FAMILY POVERTY
58.2/ 100
METRIC RATING
170th/ 347
METRIC RANK
8.1%
FAMILY POVERTY
95.6/ 100
METRIC RATING
103rd/ 347
METRIC RANK

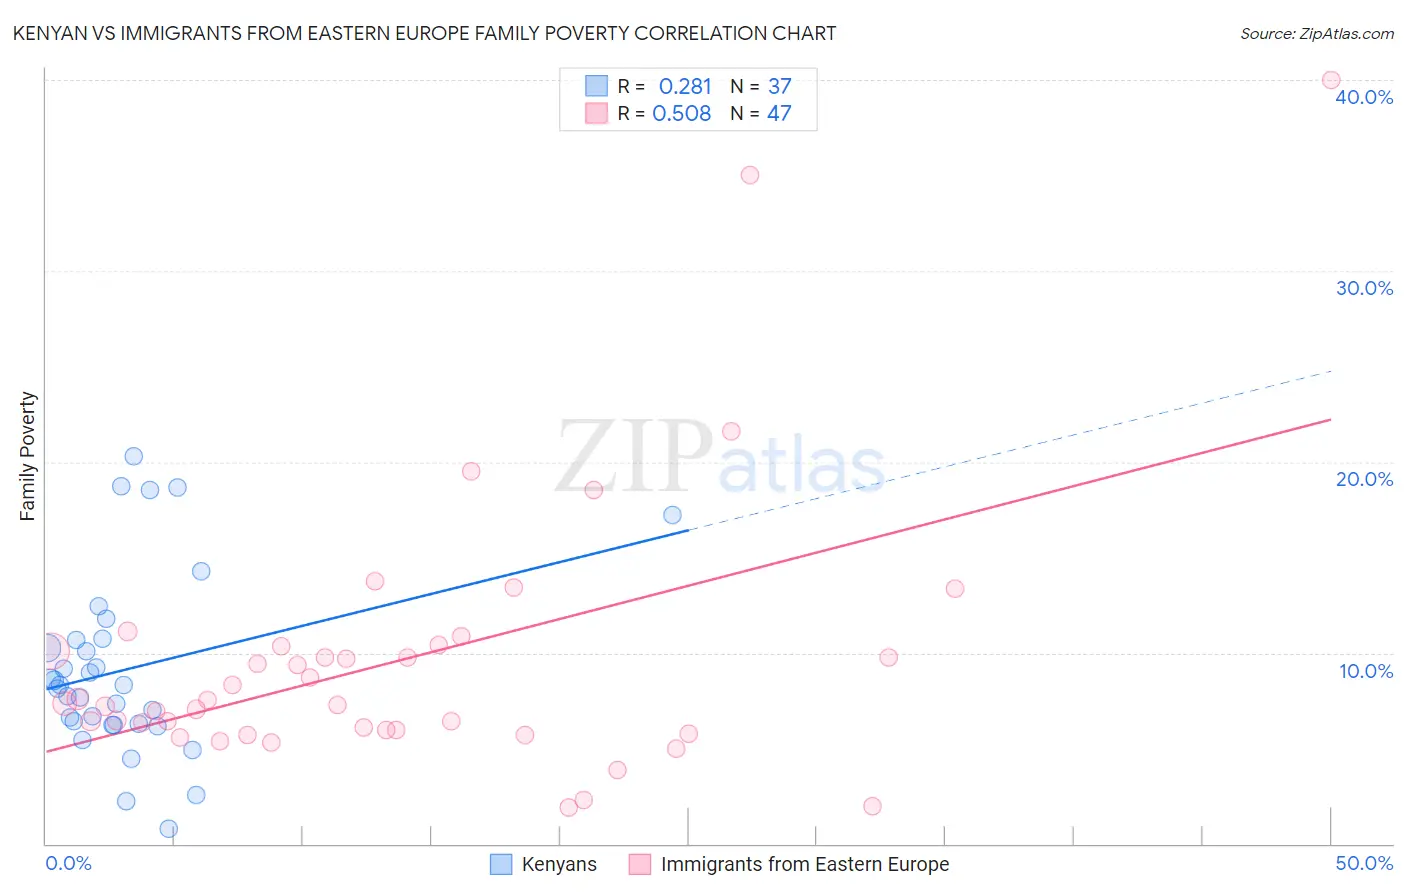
Kenyan vs Immigrants from Eastern Europe Family Poverty Correlation Chart

The statistical analysis conducted on geographies consisting of 168,038,695 people shows a weak positive correlation between the proportion of Kenyans and poverty level among families in the United States with a correlation coefficient (R) of 0.281 and weighted average of 8.9%. Similarly, the statistical analysis conducted on geographies consisting of 473,559,356 people shows a substantial positive correlation between the proportion of Immigrants from Eastern Europe and poverty level among families in the United States with a correlation coefficient (R) of 0.508 and weighted average of 8.1%, a difference of 10.0%.
Kenyan vs Immigrants from Eastern Europe Family Poverty

Family Poverty Correlation Summary

MeasurementKenyanImmigrants from Eastern Europe
Minimum0.77%1.9%
Maximum20.3%40.0%
Range19.5%38.1%
Mean9.1%9.6%
Median8.3%7.4%
Interquartile 25% (IQ1)6.2%5.9%
Interquartile 75% (IQ3)10.7%10.4%
Interquartile Range (IQR)4.5%4.4%
Standard Deviation (Sample)4.7%7.2%
Standard Deviation (Population)4.6%7.1%

Similar Demographics by Family Poverty

Demographics Similar to Kenyans by Family Poverty

In terms of family poverty, the demographic groups most similar to Kenyans are Lebanese (8.9%, a difference of 0.080%), Immigrants from Peru (8.9%, a difference of 0.090%), Immigrants from Chile (8.9%, a difference of 0.19%), Immigrants from Fiji (8.9%, a difference of 0.25%), and Israeli (8.9%, a difference of 0.54%).
DemographicsRating | RankFamily Poverty
Pennsylvania Germans
66.0
/100
|
#163
Good
8.8%
Celtics
64.9
/100
|
#164
Good
8.8%
Guamanians/Chamorros
64.7
/100
|
#165
Good
8.8%
Afghans
63.5
/100
|
#166
Good
8.8%
Immigrants | Ethiopia
62.5
/100
|
#167
Good
8.9%
Israelis
62.1
/100
|
#168
Good
8.9%
Immigrants | Chile
59.6
/100
|
#169
Average
8.9%
Kenyans
58.2
/100
|
#170
Average
8.9%
Lebanese
57.6
/100
|
#171
Average
8.9%
Immigrants | Peru
57.5
/100
|
#172
Average
8.9%
Immigrants | Fiji
56.4
/100
|
#173
Average
8.9%
Immigrants | Albania
50.0
/100
|
#174
Average
9.0%
Costa Ricans
49.3
/100
|
#175
Average
9.0%
Immigrants | Syria
47.5
/100
|
#176
Average
9.0%
Hawaiians
47.2
/100
|
#177
Average
9.0%

Demographics Similar to Immigrants from Eastern Europe by Family Poverty

In terms of family poverty, the demographic groups most similar to Immigrants from Eastern Europe are Slavic (8.1%, a difference of 0.010%), Laotian (8.1%, a difference of 0.040%), Immigrants from Indonesia (8.1%, a difference of 0.090%), Immigrants from Norway (8.1%, a difference of 0.10%), and New Zealander (8.1%, a difference of 0.13%).
DemographicsRating | RankFamily Poverty
Immigrants | Turkey
96.5
/100
|
#96
Exceptional
8.0%
Immigrants | Switzerland
96.1
/100
|
#97
Exceptional
8.1%
Immigrants | South Africa
95.9
/100
|
#98
Exceptional
8.1%
Welsh
95.8
/100
|
#99
Exceptional
8.1%
New Zealanders
95.8
/100
|
#100
Exceptional
8.1%
Immigrants | Norway
95.7
/100
|
#101
Exceptional
8.1%
Immigrants | Indonesia
95.7
/100
|
#102
Exceptional
8.1%
Immigrants | Eastern Europe
95.6
/100
|
#103
Exceptional
8.1%
Slavs
95.6
/100
|
#104
Exceptional
8.1%
Laotians
95.6
/100
|
#105
Exceptional
8.1%
Egyptians
95.1
/100
|
#106
Exceptional
8.1%
French Canadians
95.0
/100
|
#107
Exceptional
8.1%
Basques
94.9
/100
|
#108
Exceptional
8.1%
Jordanians
94.8
/100
|
#109
Exceptional
8.2%
Romanians
94.7
/100
|
#110
Exceptional
8.2%