Jordanian vs Kenyan Child Poverty Among Girls Under 16
COMPARE
Jordanian
Kenyan
Child Poverty Among Girls Under 16
Child Poverty Among Girls Under 16 Comparison
Jordanians
Kenyans
14.8%
CHILD POVERTY AMONG GIRLS UNDER 16
97.1/ 100
METRIC RATING
89th/ 347
METRIC RANK
16.8%
CHILD POVERTY AMONG GIRLS UNDER 16
32.3/ 100
METRIC RATING
190th/ 347
METRIC RANK
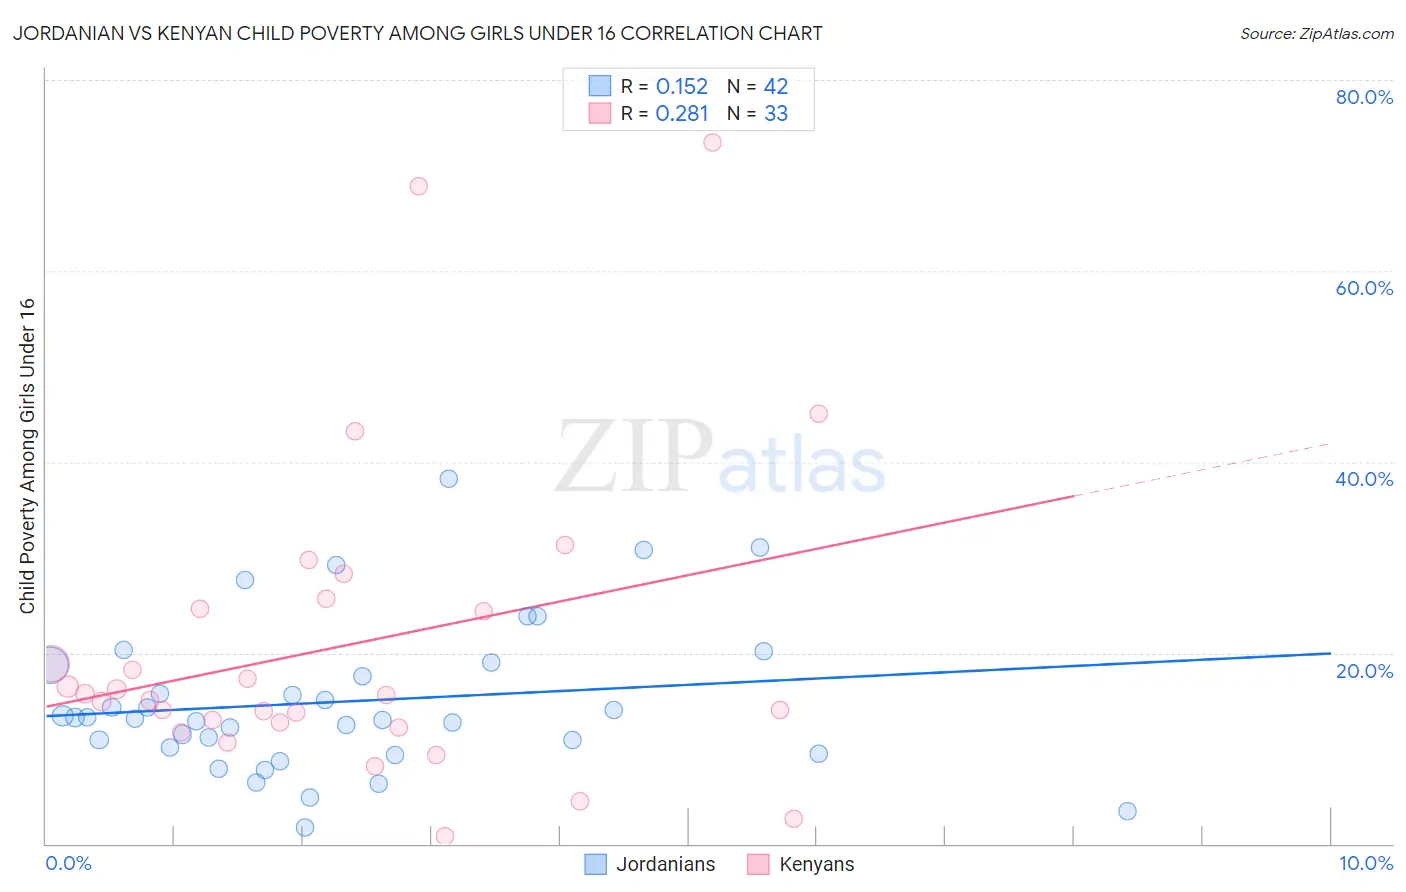
Jordanian vs Kenyan Child Poverty Among Girls Under 16 Correlation Chart
The statistical analysis conducted on geographies consisting of 165,455,872 people shows a poor positive correlation between the proportion of Jordanians and poverty level among girls under the age of 16 in the United States with a correlation coefficient (R) of 0.152 and weighted average of 14.8%. Similarly, the statistical analysis conducted on geographies consisting of 167,122,330 people shows a weak positive correlation between the proportion of Kenyans and poverty level among girls under the age of 16 in the United States with a correlation coefficient (R) of 0.281 and weighted average of 16.8%, a difference of 13.5%.
Child Poverty Among Girls Under 16 Correlation Summary
| Measurement | Jordanian | Kenyan |
| Minimum | 1.7% | 0.77% |
| Maximum | 38.3% | 73.5% |
| Range | 36.5% | 72.7% |
| Mean | 14.9% | 20.7% |
| Median | 13.2% | 15.6% |
| Interquartile 25% (IQ1) | 10.1% | 12.4% |
| Interquartile 75% (IQ3) | 18.7% | 25.1% |
| Interquartile Range (IQR) | 8.6% | 12.7% |
| Standard Deviation (Sample) | 7.9% | 16.3% |
| Standard Deviation (Population) | 7.8% | 16.1% |
Similar Demographics by Child Poverty Among Girls Under 16
Demographics Similar to Jordanians by Child Poverty Among Girls Under 16
In terms of child poverty among girls under 16, the demographic groups most similar to Jordanians are Northern European (14.8%, a difference of 0.020%), Immigrants from Canada (14.8%, a difference of 0.050%), Immigrants from Belarus (14.8%, a difference of 0.060%), Finnish (14.8%, a difference of 0.12%), and Australian (14.8%, a difference of 0.14%).
| Demographics | Rating | Rank | Child Poverty Among Girls Under 16 |
| Macedonians | 97.6 /100 | #82 | Exceptional 14.7% |
| Immigrants | Italy | 97.4 /100 | #83 | Exceptional 14.8% |
| Soviet Union | 97.3 /100 | #84 | Exceptional 14.8% |
| Swiss | 97.2 /100 | #85 | Exceptional 14.8% |
| Australians | 97.2 /100 | #86 | Exceptional 14.8% |
| Finns | 97.2 /100 | #87 | Exceptional 14.8% |
| Immigrants | Canada | 97.1 /100 | #88 | Exceptional 14.8% |
| Jordanians | 97.1 /100 | #89 | Exceptional 14.8% |
| Northern Europeans | 97.0 /100 | #90 | Exceptional 14.8% |
| Immigrants | Belarus | 97.0 /100 | #91 | Exceptional 14.8% |
| Austrians | 96.7 /100 | #92 | Exceptional 14.9% |
| Immigrants | North America | 96.6 /100 | #93 | Exceptional 14.9% |
| Immigrants | Switzerland | 96.3 /100 | #94 | Exceptional 14.9% |
| Germans | 96.3 /100 | #95 | Exceptional 14.9% |
| Immigrants | France | 96.2 /100 | #96 | Exceptional 14.9% |
Demographics Similar to Kenyans by Child Poverty Among Girls Under 16
In terms of child poverty among girls under 16, the demographic groups most similar to Kenyans are Immigrants from Bosnia and Herzegovina (16.8%, a difference of 0.040%), Immigrants from the Azores (16.8%, a difference of 0.12%), Immigrants from Uganda (16.8%, a difference of 0.13%), Immigrants from Morocco (16.8%, a difference of 0.29%), and Arab (16.8%, a difference of 0.29%).
| Demographics | Rating | Rank | Child Poverty Among Girls Under 16 |
| Immigrants | Portugal | 42.5 /100 | #183 | Average 16.6% |
| Scotch-Irish | 39.6 /100 | #184 | Fair 16.7% |
| Immigrants | Uruguay | 35.6 /100 | #185 | Fair 16.7% |
| South American Indians | 35.0 /100 | #186 | Fair 16.8% |
| Immigrants | Morocco | 34.6 /100 | #187 | Fair 16.8% |
| Arabs | 34.5 /100 | #188 | Fair 16.8% |
| Immigrants | Bosnia and Herzegovina | 32.5 /100 | #189 | Fair 16.8% |
| Kenyans | 32.3 /100 | #190 | Fair 16.8% |
| Immigrants | Azores | 31.3 /100 | #191 | Fair 16.8% |
| Immigrants | Uganda | 31.3 /100 | #192 | Fair 16.8% |
| Aleuts | 28.7 /100 | #193 | Fair 16.9% |
| Spanish | 28.6 /100 | #194 | Fair 16.9% |
| Immigrants | Costa Rica | 25.6 /100 | #195 | Fair 17.0% |
| Celtics | 25.2 /100 | #196 | Fair 17.0% |
| Spaniards | 24.9 /100 | #197 | Fair 17.0% |