Jamaican vs Immigrants from Sri Lanka Male Poverty
COMPARE
Jamaican
Immigrants from Sri Lanka
Male Poverty
Male Poverty Comparison
Jamaicans
Immigrants from Sri Lanka
13.2%
MALE POVERTY
0.1/ 100
METRIC RATING
265th/ 347
METRIC RANK
10.2%
MALE POVERTY
97.2/ 100
METRIC RATING
68th/ 347
METRIC RANK
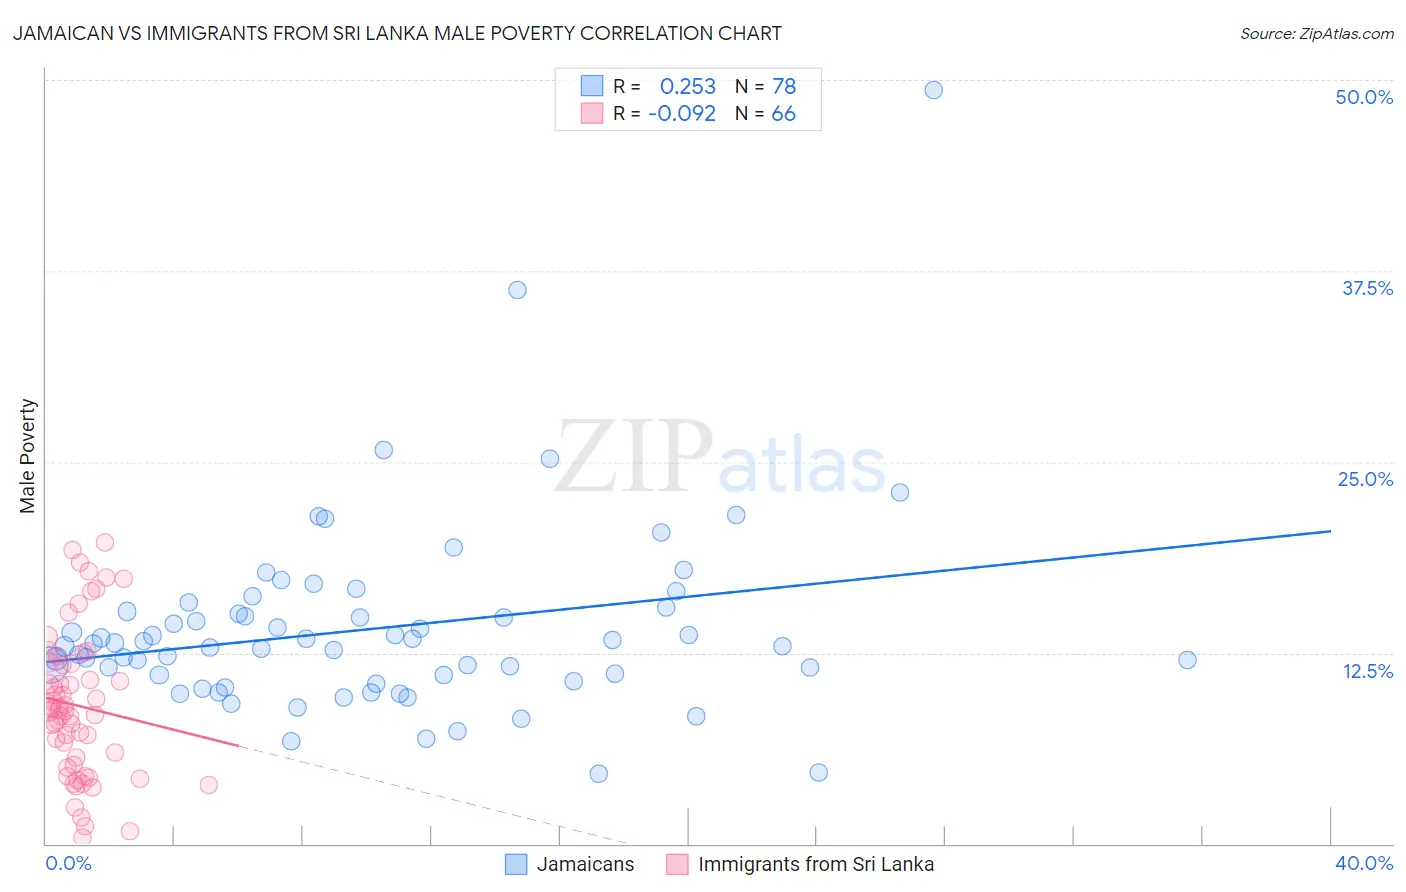
Jamaican vs Immigrants from Sri Lanka Male Poverty Correlation Chart
The statistical analysis conducted on geographies consisting of 367,625,725 people shows a weak positive correlation between the proportion of Jamaicans and poverty level among males in the United States with a correlation coefficient (R) of 0.253 and weighted average of 13.2%. Similarly, the statistical analysis conducted on geographies consisting of 149,670,593 people shows a slight negative correlation between the proportion of Immigrants from Sri Lanka and poverty level among males in the United States with a correlation coefficient (R) of -0.092 and weighted average of 10.2%, a difference of 29.4%.
Male Poverty Correlation Summary
| Measurement | Jamaican | Immigrants from Sri Lanka |
| Minimum | 4.6% | 0.43% |
| Maximum | 49.4% | 19.7% |
| Range | 44.8% | 19.3% |
| Mean | 14.1% | 9.0% |
| Median | 13.0% | 8.7% |
| Interquartile 25% (IQ1) | 11.0% | 5.2% |
| Interquartile 75% (IQ3) | 15.2% | 11.8% |
| Interquartile Range (IQR) | 4.2% | 6.6% |
| Standard Deviation (Sample) | 6.3% | 4.7% |
| Standard Deviation (Population) | 6.3% | 4.7% |
Similar Demographics by Male Poverty
Demographics Similar to Jamaicans by Male Poverty
In terms of male poverty, the demographic groups most similar to Jamaicans are Iroquois (13.2%, a difference of 0.020%), Immigrants from Guyana (13.2%, a difference of 0.14%), Immigrants from Jamaica (13.3%, a difference of 0.26%), Subsaharan African (13.3%, a difference of 0.28%), and Central American (13.2%, a difference of 0.38%).
| Demographics | Rating | Rank | Male Poverty |
| Cape Verdeans | 0.1 /100 | #258 | Tragic 13.1% |
| Cherokee | 0.1 /100 | #259 | Tragic 13.1% |
| Ottawa | 0.1 /100 | #260 | Tragic 13.1% |
| Trinidadians and Tobagonians | 0.1 /100 | #261 | Tragic 13.1% |
| Spanish American Indians | 0.1 /100 | #262 | Tragic 13.1% |
| Central Americans | 0.1 /100 | #263 | Tragic 13.2% |
| Iroquois | 0.1 /100 | #264 | Tragic 13.2% |
| Jamaicans | 0.1 /100 | #265 | Tragic 13.2% |
| Immigrants | Guyana | 0.1 /100 | #266 | Tragic 13.2% |
| Immigrants | Jamaica | 0.1 /100 | #267 | Tragic 13.3% |
| Sub-Saharan Africans | 0.1 /100 | #268 | Tragic 13.3% |
| Guyanese | 0.0 /100 | #269 | Tragic 13.3% |
| Cree | 0.0 /100 | #270 | Tragic 13.3% |
| Spanish Americans | 0.0 /100 | #271 | Tragic 13.4% |
| Immigrants | Bahamas | 0.0 /100 | #272 | Tragic 13.5% |
Demographics Similar to Immigrants from Sri Lanka by Male Poverty
In terms of male poverty, the demographic groups most similar to Immigrants from Sri Lanka are Immigrants from Netherlands (10.2%, a difference of 0.050%), Immigrants from Australia (10.2%, a difference of 0.13%), Paraguayan (10.2%, a difference of 0.15%), European (10.2%, a difference of 0.18%), and Immigrants from Canada (10.2%, a difference of 0.18%).
| Demographics | Rating | Rank | Male Poverty |
| Austrians | 97.8 /100 | #61 | Exceptional 10.1% |
| Immigrants | Italy | 97.8 /100 | #62 | Exceptional 10.2% |
| Slovaks | 97.7 /100 | #63 | Exceptional 10.2% |
| Swiss | 97.5 /100 | #64 | Exceptional 10.2% |
| Zimbabweans | 97.5 /100 | #65 | Exceptional 10.2% |
| Serbians | 97.5 /100 | #66 | Exceptional 10.2% |
| Immigrants | Netherlands | 97.3 /100 | #67 | Exceptional 10.2% |
| Immigrants | Sri Lanka | 97.2 /100 | #68 | Exceptional 10.2% |
| Immigrants | Australia | 97.1 /100 | #69 | Exceptional 10.2% |
| Paraguayans | 97.1 /100 | #70 | Exceptional 10.2% |
| Europeans | 97.1 /100 | #71 | Exceptional 10.2% |
| Immigrants | Canada | 97.1 /100 | #72 | Exceptional 10.2% |
| Immigrants | Asia | 97.0 /100 | #73 | Exceptional 10.2% |
| Immigrants | Eastern Europe | 96.9 /100 | #74 | Exceptional 10.2% |
| Carpatho Rusyns | 96.9 /100 | #75 | Exceptional 10.2% |