Israeli vs Immigrants from Philippines Child Poverty Under the Age of 16
COMPARE
Israeli
Immigrants from Philippines
Child Poverty Under the Age of 16
Child Poverty Under the Age of 16 Comparison
Israelis
Immigrants from Philippines
15.5%
CHILD POVERTY UNDER THE AGE OF 16
80.1/ 100
METRIC RATING
149th/ 347
METRIC RANK
14.3%
CHILD POVERTY UNDER THE AGE OF 16
98.2/ 100
METRIC RATING
65th/ 347
METRIC RANK
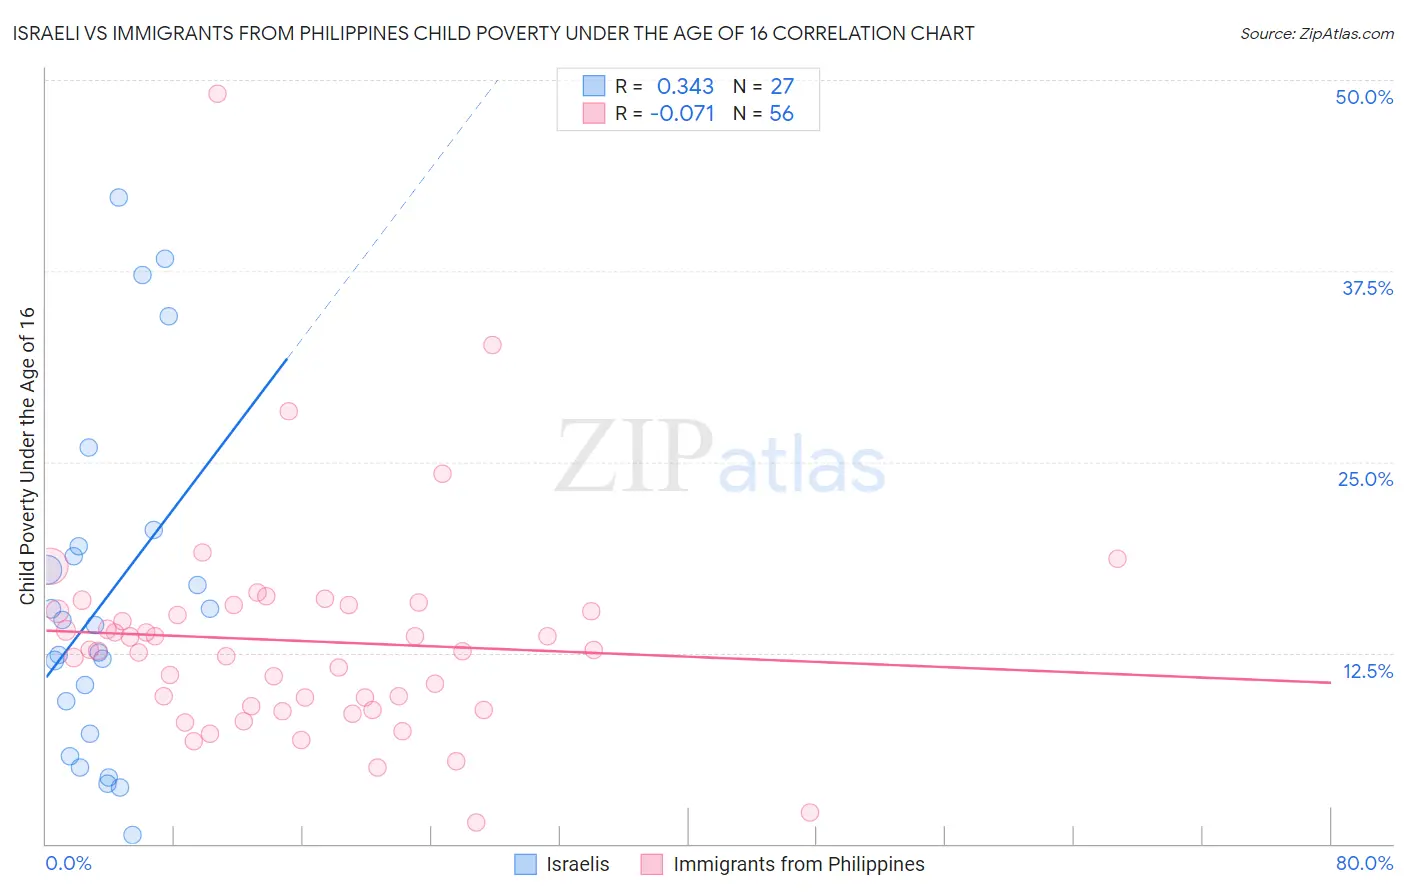
Israeli vs Immigrants from Philippines Child Poverty Under the Age of 16 Correlation Chart
The statistical analysis conducted on geographies consisting of 209,541,802 people shows a mild positive correlation between the proportion of Israelis and poverty level among children under the age of 16 in the United States with a correlation coefficient (R) of 0.343 and weighted average of 15.5%. Similarly, the statistical analysis conducted on geographies consisting of 466,147,188 people shows a slight negative correlation between the proportion of Immigrants from Philippines and poverty level among children under the age of 16 in the United States with a correlation coefficient (R) of -0.071 and weighted average of 14.3%, a difference of 8.8%.
Child Poverty Under the Age of 16 Correlation Summary
| Measurement | Israeli | Immigrants from Philippines |
| Minimum | 0.61% | 1.4% |
| Maximum | 42.3% | 49.1% |
| Range | 41.7% | 47.7% |
| Mean | 16.0% | 13.3% |
| Median | 14.3% | 12.7% |
| Interquartile 25% (IQ1) | 7.2% | 8.9% |
| Interquartile 75% (IQ3) | 19.5% | 15.4% |
| Interquartile Range (IQR) | 12.3% | 6.5% |
| Standard Deviation (Sample) | 11.2% | 7.3% |
| Standard Deviation (Population) | 10.9% | 7.3% |
Similar Demographics by Child Poverty Under the Age of 16
Demographics Similar to Israelis by Child Poverty Under the Age of 16
In terms of child poverty under the age of 16, the demographic groups most similar to Israelis are Puget Sound Salish (15.5%, a difference of 0.040%), Immigrants from Kuwait (15.5%, a difference of 0.070%), Slovak (15.5%, a difference of 0.27%), Immigrants from Peru (15.5%, a difference of 0.31%), and Immigrants from Jordan (15.6%, a difference of 0.32%).
| Demographics | Rating | Rank | Child Poverty Under the Age of 16 |
| Brazilians | 82.8 /100 | #142 | Excellent 15.4% |
| Icelanders | 82.5 /100 | #143 | Excellent 15.4% |
| Immigrants | Hungary | 81.9 /100 | #144 | Excellent 15.5% |
| Immigrants | Peru | 81.7 /100 | #145 | Excellent 15.5% |
| Slovaks | 81.4 /100 | #146 | Excellent 15.5% |
| Immigrants | Kuwait | 80.5 /100 | #147 | Excellent 15.5% |
| Puget Sound Salish | 80.3 /100 | #148 | Excellent 15.5% |
| Israelis | 80.1 /100 | #149 | Excellent 15.5% |
| Immigrants | Jordan | 78.5 /100 | #150 | Good 15.6% |
| French | 78.5 /100 | #151 | Good 15.6% |
| French Canadians | 78.2 /100 | #152 | Good 15.6% |
| Venezuelans | 77.4 /100 | #153 | Good 15.6% |
| Samoans | 77.3 /100 | #154 | Good 15.6% |
| Syrians | 76.1 /100 | #155 | Good 15.6% |
| Immigrants | Venezuela | 74.9 /100 | #156 | Good 15.7% |
Demographics Similar to Immigrants from Philippines by Child Poverty Under the Age of 16
In terms of child poverty under the age of 16, the demographic groups most similar to Immigrants from Philippines are Slovene (14.3%, a difference of 0.18%), European (14.3%, a difference of 0.21%), Immigrants from Romania (14.2%, a difference of 0.26%), Laotian (14.3%, a difference of 0.31%), and Immigrants from Europe (14.2%, a difference of 0.39%).
| Demographics | Rating | Rank | Child Poverty Under the Age of 16 |
| Immigrants | Pakistan | 98.6 /100 | #58 | Exceptional 14.1% |
| Scandinavians | 98.6 /100 | #59 | Exceptional 14.1% |
| Immigrants | Austria | 98.5 /100 | #60 | Exceptional 14.2% |
| Immigrants | Sweden | 98.5 /100 | #61 | Exceptional 14.2% |
| Zimbabweans | 98.5 /100 | #62 | Exceptional 14.2% |
| Immigrants | Europe | 98.4 /100 | #63 | Exceptional 14.2% |
| Immigrants | Romania | 98.3 /100 | #64 | Exceptional 14.2% |
| Immigrants | Philippines | 98.2 /100 | #65 | Exceptional 14.3% |
| Slovenes | 98.1 /100 | #66 | Exceptional 14.3% |
| Europeans | 98.1 /100 | #67 | Exceptional 14.3% |
| Laotians | 98.0 /100 | #68 | Exceptional 14.3% |
| Immigrants | Bulgaria | 98.0 /100 | #69 | Exceptional 14.3% |
| Immigrants | Netherlands | 97.9 /100 | #70 | Exceptional 14.3% |
| Immigrants | Poland | 97.9 /100 | #71 | Exceptional 14.3% |
| Cambodians | 97.8 /100 | #72 | Exceptional 14.4% |