Israeli vs Immigrants from North Macedonia Child Poverty Among Boys Under 16

COMPARE

Israeli
Race
Ancestry
AfghanAfricanAlaska NativeAlaskan AthabascanAlbanianAleutAlsatianAmericanApacheArabArapahoArgentineanArmenianAssyrian/Chaldean/SyriacAustralianAustrianBahamianBangladeshiBarbadianBasqueBelgianBelizeanBermudanBhutaneseBlackfeetBolivianBrazilianBritishBritish West IndianBulgarianBurmeseCajunCambodianCanadianCape VerdeanCarpatho RusynCelticCentral AmericanCentral American IndianCherokeeCheyenneChickasawChileanChineseChippewaChoctawColombianColvilleComancheCosta RicanCreeCreekCroatianCrowCubanCypriotCzechCzechoslovakianDanishDelawareDominicanDutchDutch West IndianEastern EuropeanEcuadorianEgyptianEnglishEstonianEthiopianEuropeanFijianFilipinoFinnishFrenchFrench American IndianFrench CanadianGermanGerman RussianGhanaianGreekGuamanian/ChamorroGuatemalanGuyaneseHaitianHmongHonduranHopiHoumaHungarianIcelanderIndian (Asian)IndonesianInupiatIranianIraqiIrishIroquoisIsraeliItalianJamaicanJapaneseJordanianKenyanKiowaKoreanLaotianLatvianLebaneseLiberianLithuanianLumbeeLuxembourgerMacedonianMalaysianMalteseMarshalleseMenomineeMexicanMexican American IndianMongolianMoroccanNative HawaiianNavajoNepaleseNew ZealanderNicaraguanNigerianNorthern EuropeanNorwegianOkinawanOsageOttawaPaiutePakistaniPalestinianPanamanianParaguayanPennsylvania GermanPeruvianPimaPolishPortuguesePotawatomiPuebloPuerto RicanPuget Sound SalishRomanianRussianSalvadoranSamoanScandinavianScotch-IrishScottishSeminoleSenegaleseSerbianShoshoneSierra LeoneanSiouxSlavicSlovakSloveneSomaliSouth AfricanSouth AmericanSouth American IndianSoviet UnionSpaniardSpanishSpanish AmericanSpanish American IndianSri LankanSubsaharan AfricanSudaneseSwedishSwissSyrianTaiwaneseThaiTlingit-HaidaTohono O'OdhamTonganTrinidadian and TobagonianTsimshianTurkishU.S. Virgin IslanderUgandanUkrainianUruguayanUteVenezuelanVietnameseWelshWest IndianYakamaYaquiYugoslavianYumanYup'ikZimbabwean
Immigration
NonimmigrantsImmigrantsAfghanistanAfricaAlbaniaArgentinaArmeniaAsiaAustraliaAustriaBahamasBangladeshBarbadosBelarusBelgiumBelizeBoliviaBosnia and HerzegovinaBrazilBulgariaBurma/MyanmarCabo VerdeCambodiaCameroonCanadaCaribbeanCentral AmericaChileChinaColombiaCongoCosta RicaCroatiaCubaCzechoslovakiaDenmarkDominicaDominican RepublicEastern AfricaEastern AsiaEastern EuropeEcuadorEgyptEl SalvadorEnglandEritreaEthiopiaEuropeFijiFranceGermanyGhanaGreeceGrenadaGuatemalaGuyanaHaitiHondurasHong KongHungaryIndiaIndonesiaIranIraqIrelandIsraelItalyJamaicaJapanJordanKazakhstanKenyaKoreaKuwaitLaosLatin AmericaLatviaLebanonLiberiaLithuaniaMalaysiaMexicoMicronesiaMiddle AfricaMoldovaMoroccoNepalNetherlandsNicaraguaNigeriaNorth AmericaNorthern AfricaNorthern EuropeNorwayOceaniaPakistanPanamaPeruPhilippinesPolandPortugalRomaniaRussiaSaudi ArabiaScotlandSenegalSerbiaSierra LeoneSingaporeSomaliaSouth AfricaSouth AmericaSouth Central AsiaSouth Eastern AsiaSouthern EuropeSpainSri LankaSt. Vincent and the GrenadinesSudanSwedenSwitzerlandSyriaTaiwanThailandTrinidad and TobagoTurkeyUgandaUkraineUruguayUzbekistanVenezuelaVietnamWest IndiesWestern AfricaWestern AsiaWestern EuropeYemenZaireZimbabweAzores
Immigrants from North Macedonia
Race
Ancestry
AfghanAfricanAlaska NativeAlaskan AthabascanAlbanianAleutAlsatianAmericanApacheArabArapahoArgentineanArmenianAssyrian/Chaldean/SyriacAustralianAustrianBahamianBangladeshiBarbadianBasqueBelgianBelizeanBermudanBhutaneseBlackfeetBolivianBrazilianBritishBritish West IndianBulgarianBurmeseCajunCambodianCanadianCape VerdeanCarpatho RusynCelticCentral AmericanCentral American IndianCherokeeCheyenneChickasawChileanChineseChippewaChoctawColombianColvilleComancheCosta RicanCreeCreekCroatianCrowCubanCypriotCzechCzechoslovakianDanishDelawareDominicanDutchDutch West IndianEastern EuropeanEcuadorianEgyptianEnglishEstonianEthiopianEuropeanFijianFilipinoFinnishFrenchFrench American IndianFrench CanadianGermanGerman RussianGhanaianGreekGuamanian/ChamorroGuatemalanGuyaneseHaitianHmongHonduranHopiHoumaHungarianIcelanderIndian (Asian)IndonesianInupiatIranianIraqiIrishIroquoisItalianJamaicanJapaneseJordanianKenyanKiowaKoreanLaotianLatvianLebaneseLiberianLithuanianLumbeeLuxembourgerMacedonianMalaysianMalteseMarshalleseMenomineeMexicanMexican American IndianMongolianMoroccanNative HawaiianNavajoNepaleseNew ZealanderNicaraguanNigerianNorthern EuropeanNorwegianOkinawanOsageOttawaPaiutePakistaniPalestinianPanamanianParaguayanPennsylvania GermanPeruvianPimaPolishPortuguesePotawatomiPuebloPuerto RicanPuget Sound SalishRomanianRussianSalvadoranSamoanScandinavianScotch-IrishScottishSeminoleSenegaleseSerbianShoshoneSierra LeoneanSiouxSlavicSlovakSloveneSomaliSouth AfricanSouth AmericanSouth American IndianSoviet UnionSpaniardSpanishSpanish AmericanSpanish American IndianSri LankanSubsaharan AfricanSudaneseSwedishSwissSyrianTaiwaneseThaiTlingit-HaidaTohono O'OdhamTonganTrinidadian and TobagonianTsimshianTurkishU.S. Virgin IslanderUgandanUkrainianUruguayanUteVenezuelanVietnameseWelshWest IndianYakamaYaquiYugoslavianYumanYup'ikZimbabwean
Immigration
NonimmigrantsImmigrantsAfghanistanAfricaAlbaniaArgentinaArmeniaAsiaAustraliaAustriaBahamasBangladeshBarbadosBelarusBelgiumBelizeBoliviaBosnia and HerzegovinaBrazilBulgariaBurma/MyanmarCabo VerdeCambodiaCameroonCanadaCaribbeanCentral AmericaChileChinaColombiaCongoCosta RicaCroatiaCubaCzechoslovakiaDenmarkDominicaDominican RepublicEastern AfricaEastern AsiaEastern EuropeEcuadorEgyptEl SalvadorEnglandEritreaEthiopiaEuropeFijiFranceGermanyGhanaGreeceGrenadaGuatemalaGuyanaHaitiHondurasHong KongHungaryIndiaIndonesiaIranIraqIrelandIsraelItalyJamaicaJapanJordanKazakhstanKenyaKoreaKuwaitLaosLatin AmericaLatviaLebanonLiberiaLithuaniaMalaysiaMexicoMicronesiaMiddle AfricaMoldovaMoroccoNepalNetherlandsNicaraguaNigeriaNorth AmericaNorth MacedoniaNorthern AfricaNorthern EuropeNorwayOceaniaPakistanPanamaPeruPhilippinesPolandPortugalRomaniaRussiaSaudi ArabiaScotlandSenegalSerbiaSierra LeoneSingaporeSomaliaSouth AfricaSouth AmericaSouth Central AsiaSouth Eastern AsiaSouthern EuropeSpainSri LankaSt. Vincent and the GrenadinesSudanSwedenSwitzerlandSyriaTaiwanThailandTrinidad and TobagoTurkeyUgandaUkraineUruguayUzbekistanVenezuelaVietnamWest IndiesWestern AfricaWestern AsiaWestern EuropeYemenZaireZimbabweAzores
Child Poverty Among Boys Under 16
Income
Poverty
Unemployment
Labor Participation
Family Structure
Vehicle Availability
Education Level
Disability

Child Poverty Among Boys Under 16 Comparison

Israelis

Immigrants from North Macedonia

Good
Exceptional
15.9%
CHILD POVERTY AMONG BOYS UNDER 16
76.5/ 100
METRIC RATING
156th/ 347
METRIC RANK
14.9%
CHILD POVERTY AMONG BOYS UNDER 16
96.3/ 100
METRIC RATING
96th/ 347
METRIC RANK

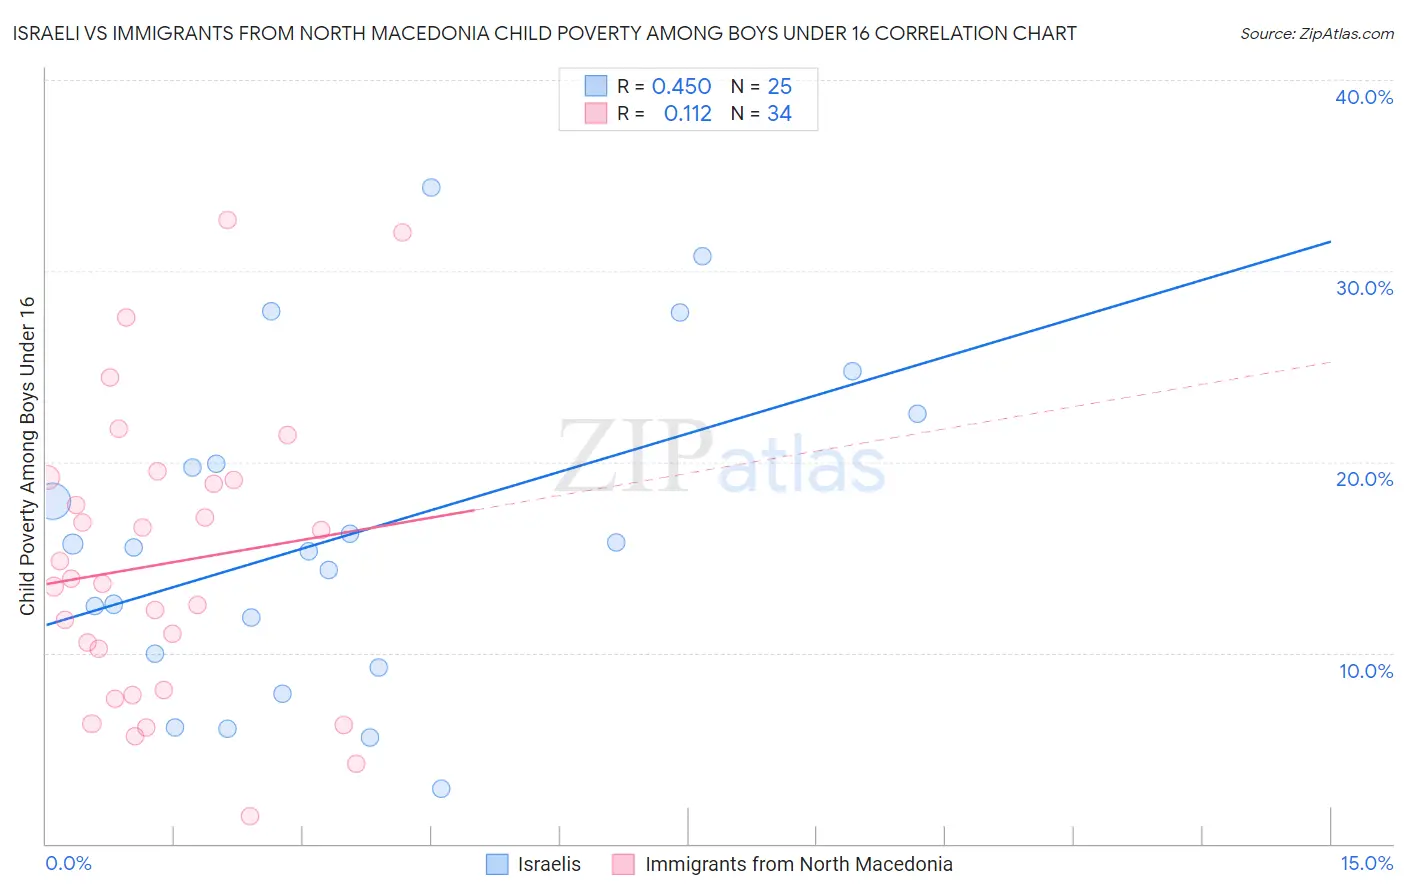
Israeli vs Immigrants from North Macedonia Child Poverty Among Boys Under 16 Correlation Chart

The statistical analysis conducted on geographies consisting of 208,424,853 people shows a moderate positive correlation between the proportion of Israelis and poverty level among boys under the age of 16 in the United States with a correlation coefficient (R) of 0.450 and weighted average of 15.9%. Similarly, the statistical analysis conducted on geographies consisting of 73,631,017 people shows a poor positive correlation between the proportion of Immigrants from North Macedonia and poverty level among boys under the age of 16 in the United States with a correlation coefficient (R) of 0.112 and weighted average of 14.9%, a difference of 6.3%.
Israeli vs Immigrants from North Macedonia Child Poverty Among Boys Under 16

Child Poverty Among Boys Under 16 Correlation Summary

MeasurementIsraeliImmigrants from North Macedonia
Minimum2.9%1.4%
Maximum34.4%32.7%
Range31.5%31.2%
Mean16.1%14.7%
Median15.5%13.7%
Interquartile 25% (IQ1)9.6%8.1%
Interquartile 75% (IQ3)21.2%19.1%
Interquartile Range (IQR)11.6%11.0%
Standard Deviation (Sample)8.3%7.6%
Standard Deviation (Population)8.2%7.4%

Similar Demographics by Child Poverty Among Boys Under 16

Demographics Similar to Israelis by Child Poverty Among Boys Under 16

In terms of child poverty among boys under 16, the demographic groups most similar to Israelis are French Canadian (15.9%, a difference of 0.010%), Immigrants from Nepal (15.9%, a difference of 0.090%), Yugoslavian (15.9%, a difference of 0.10%), Syrian (15.9%, a difference of 0.16%), and Immigrants from Chile (15.9%, a difference of 0.27%).
DemographicsRating | RankChild Poverty Among Boys Under 16
Slovaks
80.3
/100
|
#149
Excellent
15.8%
Immigrants | Jordan
80.2
/100
|
#150
Excellent
15.8%
Puget Sound Salish
79.8
/100
|
#151
Good
15.8%
Immigrants | Venezuela
79.5
/100
|
#152
Good
15.8%
French
78.7
/100
|
#153
Good
15.8%
Syrians
77.5
/100
|
#154
Good
15.9%
French Canadians
76.6
/100
|
#155
Good
15.9%
Israelis
76.5
/100
|
#156
Good
15.9%
Immigrants | Nepal
76.0
/100
|
#157
Good
15.9%
Yugoslavians
75.9
/100
|
#158
Good
15.9%
Immigrants | Chile
74.8
/100
|
#159
Good
15.9%
Immigrants | Northern Africa
71.3
/100
|
#160
Good
16.0%
Immigrants | Oceania
71.3
/100
|
#161
Good
16.0%
Guamanians/Chamorros
69.6
/100
|
#162
Good
16.1%
Costa Ricans
68.1
/100
|
#163
Good
16.1%

Demographics Similar to Immigrants from North Macedonia by Child Poverty Among Boys Under 16

In terms of child poverty among boys under 16, the demographic groups most similar to Immigrants from North Macedonia are Immigrants from Egypt (14.9%, a difference of 0.010%), British (15.0%, a difference of 0.050%), Immigrants from France (15.0%, a difference of 0.15%), Finnish (14.9%, a difference of 0.25%), and Sri Lankan (14.9%, a difference of 0.36%).
DemographicsRating | RankChild Poverty Among Boys Under 16
Immigrants | Argentina
97.1
/100
|
#89
Exceptional
14.8%
Austrians
97.1
/100
|
#90
Exceptional
14.8%
Paraguayans
96.8
/100
|
#91
Exceptional
14.9%
Argentineans
96.7
/100
|
#92
Exceptional
14.9%
Sri Lankans
96.7
/100
|
#93
Exceptional
14.9%
Immigrants | Italy
96.7
/100
|
#94
Exceptional
14.9%
Finns
96.5
/100
|
#95
Exceptional
14.9%
Immigrants | North Macedonia
96.3
/100
|
#96
Exceptional
14.9%
Immigrants | Egypt
96.2
/100
|
#97
Exceptional
14.9%
British
96.2
/100
|
#98
Exceptional
15.0%
Immigrants | France
96.1
/100
|
#99
Exceptional
15.0%
Chileans
95.8
/100
|
#100
Exceptional
15.0%
Immigrants | Belarus
95.7
/100
|
#101
Exceptional
15.0%
Romanians
95.6
/100
|
#102
Exceptional
15.0%
Immigrants | Denmark
95.6
/100
|
#103
Exceptional
15.0%