Israeli vs Celtic Family Poverty
COMPARE
Israeli
Celtic
Family Poverty
Family Poverty Comparison
Israelis
Celtics
8.9%
FAMILY POVERTY
62.1/ 100
METRIC RATING
168th/ 347
METRIC RANK
8.8%
FAMILY POVERTY
64.9/ 100
METRIC RATING
164th/ 347
METRIC RANK
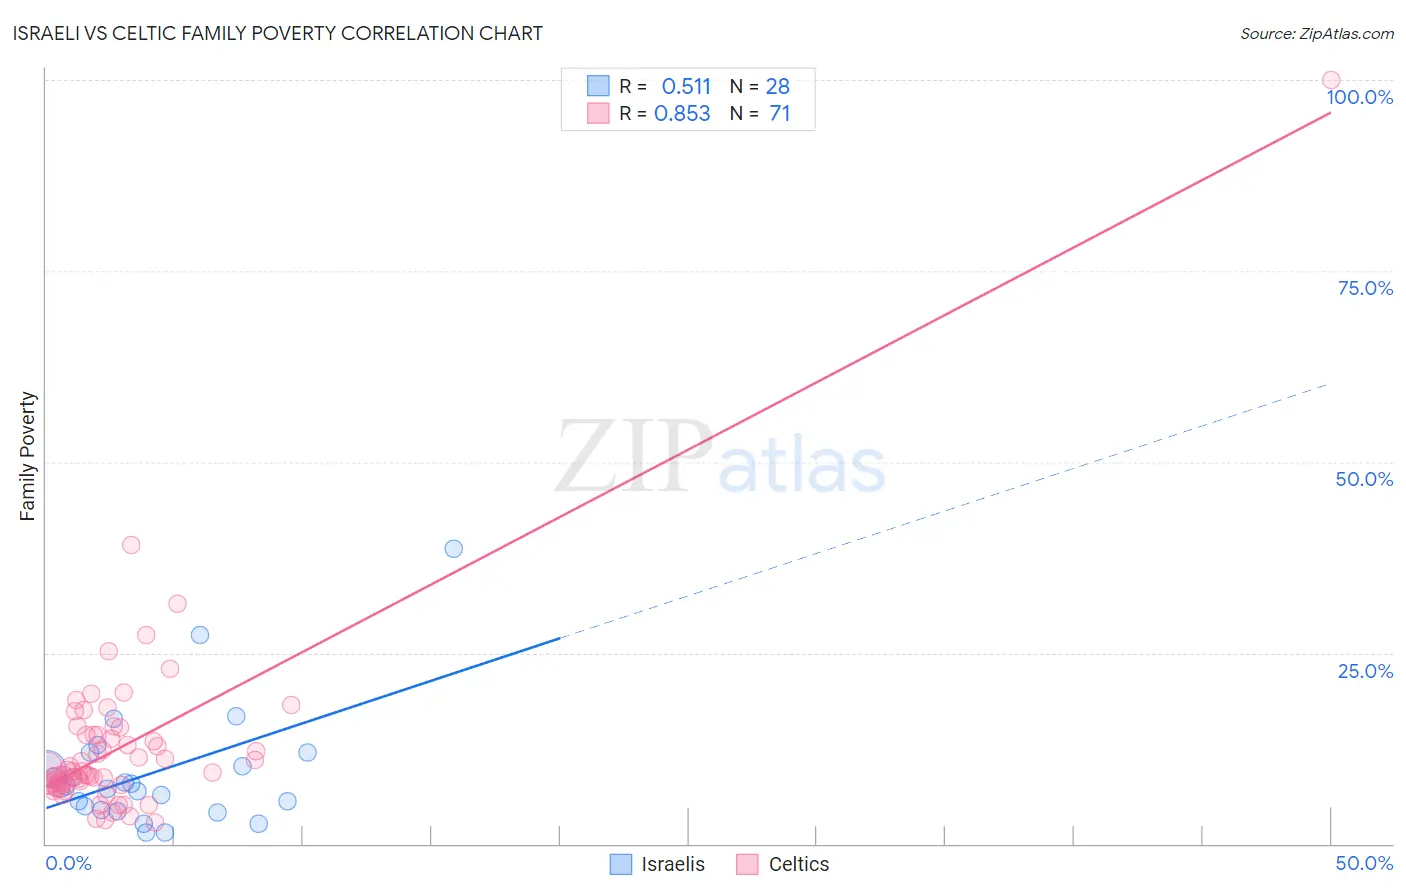
Israeli vs Celtic Family Poverty Correlation Chart
The statistical analysis conducted on geographies consisting of 210,674,574 people shows a substantial positive correlation between the proportion of Israelis and poverty level among families in the United States with a correlation coefficient (R) of 0.511 and weighted average of 8.9%. Similarly, the statistical analysis conducted on geographies consisting of 168,628,915 people shows a very strong positive correlation between the proportion of Celtics and poverty level among families in the United States with a correlation coefficient (R) of 0.853 and weighted average of 8.8%, a difference of 0.41%.
Family Poverty Correlation Summary
| Measurement | Israeli | Celtic |
| Minimum | 1.4% | 2.8% |
| Maximum | 38.6% | 100.0% |
| Range | 37.2% | 97.2% |
| Mean | 9.3% | 12.7% |
| Median | 7.5% | 9.4% |
| Interquartile 25% (IQ1) | 4.6% | 7.6% |
| Interquartile 75% (IQ3) | 11.0% | 14.2% |
| Interquartile Range (IQR) | 6.4% | 6.6% |
| Standard Deviation (Sample) | 7.9% | 12.4% |
| Standard Deviation (Population) | 7.8% | 12.3% |
Demographics Similar to Israelis and Celtics by Family Poverty
In terms of family poverty, the demographic groups most similar to Israelis are Immigrants from Ethiopia (8.9%, a difference of 0.060%), Afghan (8.8%, a difference of 0.20%), Immigrants from Chile (8.9%, a difference of 0.35%), Guamanian/Chamorro (8.8%, a difference of 0.38%), and Kenyan (8.9%, a difference of 0.54%). Similarly, the demographic groups most similar to Celtics are Guamanian/Chamorro (8.8%, a difference of 0.030%), Pennsylvania German (8.8%, a difference of 0.16%), Ethiopian (8.8%, a difference of 0.21%), Afghan (8.8%, a difference of 0.21%), and Immigrants from Northern Africa (8.8%, a difference of 0.30%).
| Demographics | Rating | Rank | Family Poverty |
| Immigrants | Oceania | 71.2 /100 | #156 | Good 8.7% |
| Tsimshian | 69.3 /100 | #157 | Good 8.8% |
| Whites/Caucasians | 69.1 /100 | #158 | Good 8.8% |
| Peruvians | 68.0 /100 | #159 | Good 8.8% |
| Hungarians | 67.2 /100 | #160 | Good 8.8% |
| Immigrants | Northern Africa | 66.9 /100 | #161 | Good 8.8% |
| Ethiopians | 66.3 /100 | #162 | Good 8.8% |
| Pennsylvania Germans | 66.0 /100 | #163 | Good 8.8% |
| Celtics | 64.9 /100 | #164 | Good 8.8% |
| Guamanians/Chamorros | 64.7 /100 | #165 | Good 8.8% |
| Afghans | 63.5 /100 | #166 | Good 8.8% |
| Immigrants | Ethiopia | 62.5 /100 | #167 | Good 8.9% |
| Israelis | 62.1 /100 | #168 | Good 8.9% |
| Immigrants | Chile | 59.6 /100 | #169 | Average 8.9% |
| Kenyans | 58.2 /100 | #170 | Average 8.9% |
| Lebanese | 57.6 /100 | #171 | Average 8.9% |
| Immigrants | Peru | 57.5 /100 | #172 | Average 8.9% |
| Immigrants | Fiji | 56.4 /100 | #173 | Average 8.9% |
| Immigrants | Albania | 50.0 /100 | #174 | Average 9.0% |
| Costa Ricans | 49.3 /100 | #175 | Average 9.0% |
| Immigrants | Syria | 47.5 /100 | #176 | Average 9.0% |