Irish vs Bolivian Single Mother Poverty

COMPARE

Irish
Race
Ancestry
AfghanAfricanAlaska NativeAlaskan AthabascanAlbanianAleutAlsatianAmericanApacheArabArapahoArgentineanArmenianAssyrian/Chaldean/SyriacAustralianAustrianBahamianBangladeshiBarbadianBasqueBelgianBelizeanBermudanBhutaneseBlackfeetBrazilianBritishBritish West IndianBulgarianBurmeseCajunCambodianCanadianCape VerdeanCarpatho RusynCelticCentral AmericanCentral American IndianCherokeeCheyenneChickasawChileanChineseChippewaChoctawColombianColvilleComancheCosta RicanCreeCreekCroatianCrowCubanCypriotCzechCzechoslovakianDanishDelawareDominicanDutchDutch West IndianEastern EuropeanEcuadorianEgyptianEnglishEstonianEthiopianEuropeanFijianFilipinoFinnishFrenchFrench American IndianFrench CanadianGermanGerman RussianGhanaianGreekGuamanian/ChamorroGuatemalanGuyaneseHaitianHmongHonduranHopiHoumaHungarianIcelanderIndian (Asian)IndonesianInupiatIranianIraqiIrishIroquoisIsraeliItalianJamaicanJapaneseJordanianKenyanKiowaKoreanLaotianLatvianLebaneseLiberianLithuanianLumbeeLuxembourgerMacedonianMalaysianMalteseMarshalleseMenomineeMexicanMexican American IndianMongolianMoroccanNative HawaiianNavajoNepaleseNew ZealanderNicaraguanNigerianNorthern EuropeanNorwegianOkinawanOsageOttawaPaiutePakistaniPalestinianPanamanianParaguayanPennsylvania GermanPeruvianPimaPolishPortuguesePotawatomiPuebloPuerto RicanPuget Sound SalishRomanianRussianSalvadoranSamoanScandinavianScotch-IrishScottishSeminoleSenegaleseSerbianShoshoneSierra LeoneanSiouxSlavicSlovakSloveneSomaliSouth AfricanSouth AmericanSouth American IndianSoviet UnionSpaniardSpanishSpanish AmericanSpanish American IndianSri LankanSubsaharan AfricanSudaneseSwedishSwissSyrianTaiwaneseThaiTlingit-HaidaTohono O'OdhamTonganTrinidadian and TobagonianTsimshianTurkishU.S. Virgin IslanderUgandanUkrainianUruguayanUteVenezuelanVietnameseWelshWest IndianYakamaYaquiYugoslavianYumanYup'ikZimbabwean
Immigration
NonimmigrantsImmigrantsAfghanistanAfricaAlbaniaArgentinaArmeniaAsiaAustraliaAustriaBahamasBangladeshBarbadosBelarusBelgiumBelizeBoliviaBosnia and HerzegovinaBrazilBulgariaBurma/MyanmarCabo VerdeCambodiaCameroonCanadaCaribbeanCentral AmericaChileChinaColombiaCongoCosta RicaCroatiaCubaCzechoslovakiaDenmarkDominicaDominican RepublicEastern AfricaEastern AsiaEastern EuropeEcuadorEgyptEl SalvadorEnglandEritreaEthiopiaEuropeFijiFranceGermanyGhanaGreeceGrenadaGuatemalaGuyanaHaitiHondurasHong KongHungaryIndiaIndonesiaIranIraqIrelandIsraelItalyJamaicaJapanJordanKazakhstanKenyaKoreaKuwaitLaosLatin AmericaLatviaLebanonLiberiaLithuaniaMalaysiaMexicoMicronesiaMiddle AfricaMoldovaMoroccoNepalNetherlandsNicaraguaNigeriaNorth AmericaNorth MacedoniaNorthern AfricaNorthern EuropeNorwayOceaniaPakistanPanamaPeruPhilippinesPolandPortugalRomaniaRussiaSaudi ArabiaScotlandSenegalSerbiaSierra LeoneSingaporeSomaliaSouth AfricaSouth AmericaSouth Central AsiaSouth Eastern AsiaSouthern EuropeSpainSri LankaSt. Vincent and the GrenadinesSudanSwedenSwitzerlandSyriaTaiwanThailandTrinidad and TobagoTurkeyUgandaUkraineUruguayUzbekistanVenezuelaVietnamWest IndiesWestern AfricaWestern AsiaWestern EuropeYemenZaireZimbabweAzores
Bolivian
Race
Ancestry
AfghanAfricanAlaska NativeAlaskan AthabascanAlbanianAleutAlsatianAmericanApacheArabArapahoArgentineanArmenianAssyrian/Chaldean/SyriacAustralianAustrianBahamianBangladeshiBarbadianBasqueBelgianBelizeanBermudanBhutaneseBlackfeetBolivianBrazilianBritishBritish West IndianBulgarianBurmeseCajunCambodianCanadianCape VerdeanCarpatho RusynCelticCentral AmericanCentral American IndianCherokeeCheyenneChickasawChileanChineseChippewaChoctawColombianColvilleComancheCosta RicanCreeCreekCroatianCrowCubanCypriotCzechCzechoslovakianDanishDelawareDominicanDutchDutch West IndianEastern EuropeanEcuadorianEgyptianEnglishEstonianEthiopianEuropeanFijianFilipinoFinnishFrenchFrench American IndianFrench CanadianGermanGerman RussianGhanaianGreekGuamanian/ChamorroGuatemalanGuyaneseHaitianHmongHonduranHopiHoumaHungarianIcelanderIndian (Asian)IndonesianInupiatIranianIraqiIroquoisIsraeliItalianJamaicanJapaneseJordanianKenyanKiowaKoreanLaotianLatvianLebaneseLiberianLithuanianLumbeeLuxembourgerMacedonianMalaysianMalteseMarshalleseMenomineeMexicanMexican American IndianMongolianMoroccanNative HawaiianNavajoNepaleseNew ZealanderNicaraguanNigerianNorthern EuropeanNorwegianOkinawanOsageOttawaPaiutePakistaniPalestinianPanamanianParaguayanPennsylvania GermanPeruvianPimaPolishPortuguesePotawatomiPuebloPuerto RicanPuget Sound SalishRomanianRussianSalvadoranSamoanScandinavianScotch-IrishScottishSeminoleSenegaleseSerbianShoshoneSierra LeoneanSiouxSlavicSlovakSloveneSomaliSouth AfricanSouth AmericanSouth American IndianSoviet UnionSpaniardSpanishSpanish AmericanSpanish American IndianSri LankanSubsaharan AfricanSudaneseSwedishSwissSyrianTaiwaneseThaiTlingit-HaidaTohono O'OdhamTonganTrinidadian and TobagonianTsimshianTurkishU.S. Virgin IslanderUgandanUkrainianUruguayanUteVenezuelanVietnameseWelshWest IndianYakamaYaquiYugoslavianYumanYup'ikZimbabwean
Immigration
NonimmigrantsImmigrantsAfghanistanAfricaAlbaniaArgentinaArmeniaAsiaAustraliaAustriaBahamasBangladeshBarbadosBelarusBelgiumBelizeBoliviaBosnia and HerzegovinaBrazilBulgariaBurma/MyanmarCabo VerdeCambodiaCameroonCanadaCaribbeanCentral AmericaChileChinaColombiaCongoCosta RicaCroatiaCubaCzechoslovakiaDenmarkDominicaDominican RepublicEastern AfricaEastern AsiaEastern EuropeEcuadorEgyptEl SalvadorEnglandEritreaEthiopiaEuropeFijiFranceGermanyGhanaGreeceGrenadaGuatemalaGuyanaHaitiHondurasHong KongHungaryIndiaIndonesiaIranIraqIrelandIsraelItalyJamaicaJapanJordanKazakhstanKenyaKoreaKuwaitLaosLatin AmericaLatviaLebanonLiberiaLithuaniaMalaysiaMexicoMicronesiaMiddle AfricaMoldovaMoroccoNepalNetherlandsNicaraguaNigeriaNorth AmericaNorth MacedoniaNorthern AfricaNorthern EuropeNorwayOceaniaPakistanPanamaPeruPhilippinesPolandPortugalRomaniaRussiaSaudi ArabiaScotlandSenegalSerbiaSierra LeoneSingaporeSomaliaSouth AfricaSouth AmericaSouth Central AsiaSouth Eastern AsiaSouthern EuropeSpainSri LankaSt. Vincent and the GrenadinesSudanSwedenSwitzerlandSyriaTaiwanThailandTrinidad and TobagoTurkeyUgandaUkraineUruguayUzbekistanVenezuelaVietnamWest IndiesWestern AfricaWestern AsiaWestern EuropeYemenZaireZimbabweAzores
Single Mother Poverty
Income
Poverty
Unemployment
Labor Participation
Family Structure
Vehicle Availability
Education Level
Disability

Single Mother Poverty Comparison

Irish

Bolivians

Poor
Exceptional
29.8%
SINGLE MOTHER POVERTY
13.9/ 100
METRIC RATING
209th/ 347
METRIC RANK
25.9%
SINGLE MOTHER POVERTY
100.0/ 100
METRIC RATING
16th/ 347
METRIC RANK

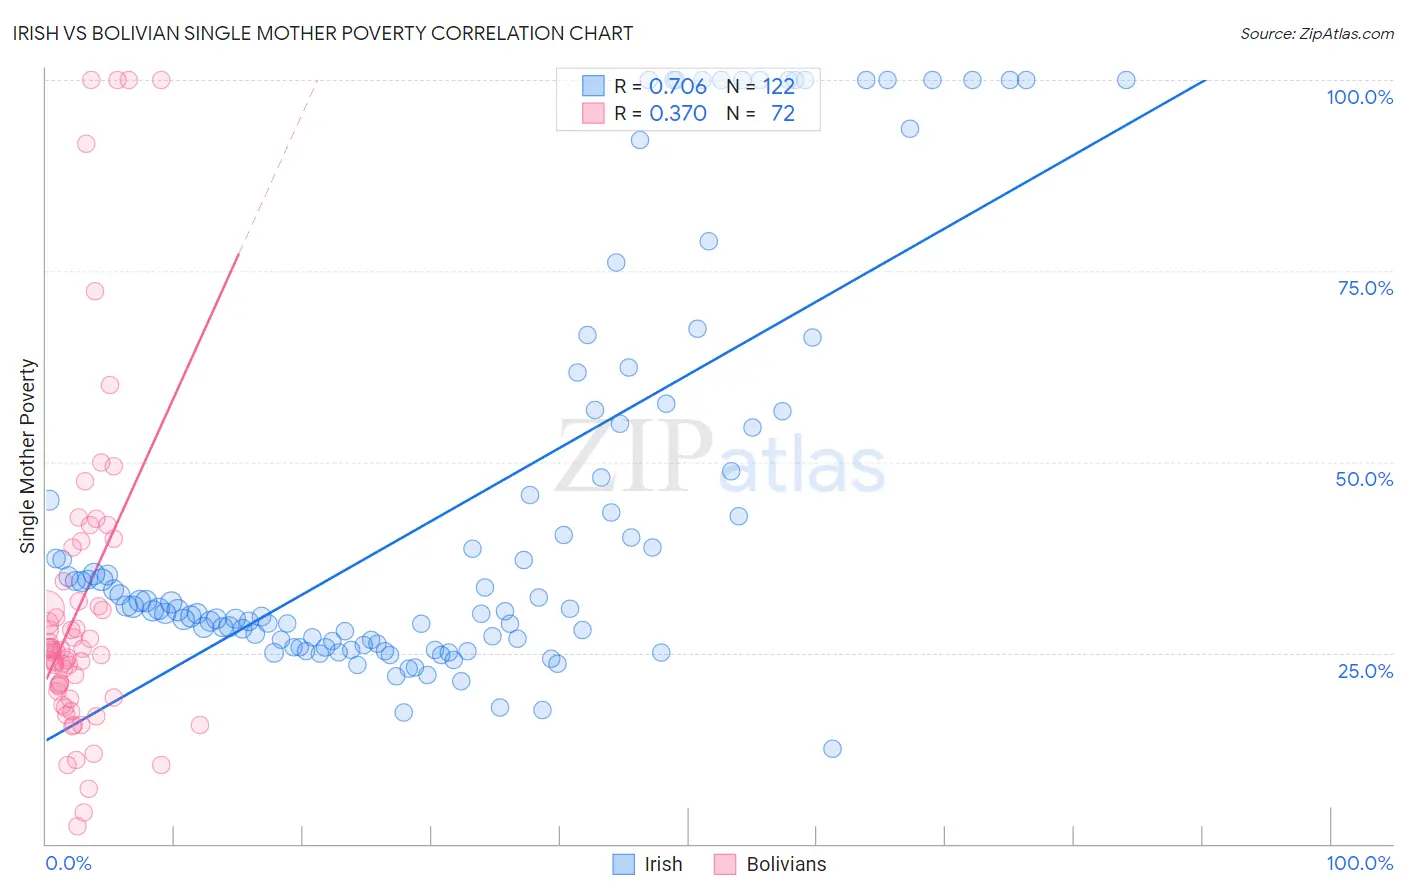
Irish vs Bolivian Single Mother Poverty Correlation Chart

The statistical analysis conducted on geographies consisting of 549,467,184 people shows a strong positive correlation between the proportion of Irish and poverty level among single mothers in the United States with a correlation coefficient (R) of 0.706 and weighted average of 29.8%. Similarly, the statistical analysis conducted on geographies consisting of 182,525,301 people shows a mild positive correlation between the proportion of Bolivians and poverty level among single mothers in the United States with a correlation coefficient (R) of 0.370 and weighted average of 25.9%, a difference of 15.0%.
Irish vs Bolivian Single Mother Poverty

Single Mother Poverty Correlation Summary

MeasurementIrishBolivian
Minimum12.4%2.2%
Maximum100.0%100.0%
Range87.6%97.8%
Mean43.8%31.3%
Median30.8%25.3%
Interquartile 25% (IQ1)26.6%19.6%
Interquartile 75% (IQ3)54.5%33.1%
Interquartile Range (IQR)28.0%13.5%
Standard Deviation (Sample)26.6%22.0%
Standard Deviation (Population)26.5%21.8%

Similar Demographics by Single Mother Poverty

Demographics Similar to Irish by Single Mother Poverty

In terms of single mother poverty, the demographic groups most similar to Irish are Haitian (29.8%, a difference of 0.060%), Immigrants from Guyana (29.8%, a difference of 0.080%), Guyanese (29.8%, a difference of 0.11%), Immigrants from Panama (29.8%, a difference of 0.15%), and Nicaraguan (29.8%, a difference of 0.15%).
DemographicsRating | RankSingle Mother Poverty
Malaysians
17.4
/100
|
#202
Poor
29.7%
Swiss
17.2
/100
|
#203
Poor
29.7%
Immigrants | Immigrants
16.6
/100
|
#204
Poor
29.7%
Czechoslovakians
16.1
/100
|
#205
Poor
29.7%
Immigrants | Haiti
15.8
/100
|
#206
Poor
29.7%
Immigrants | Panama
15.5
/100
|
#207
Poor
29.8%
Immigrants | Guyana
14.7
/100
|
#208
Poor
29.8%
Irish
13.9
/100
|
#209
Poor
29.8%
Haitians
13.3
/100
|
#210
Poor
29.8%
Guyanese
12.8
/100
|
#211
Poor
29.8%
Nicaraguans
12.4
/100
|
#212
Poor
29.8%
Immigrants | Thailand
12.0
/100
|
#213
Poor
29.9%
Liberians
11.7
/100
|
#214
Poor
29.9%
Jamaicans
11.7
/100
|
#215
Poor
29.9%
Immigrants | Western Africa
11.5
/100
|
#216
Poor
29.9%

Demographics Similar to Bolivians by Single Mother Poverty

In terms of single mother poverty, the demographic groups most similar to Bolivians are Asian (26.0%, a difference of 0.18%), Immigrants from Ireland (25.8%, a difference of 0.29%), Immigrants from Pakistan (26.0%, a difference of 0.46%), Immigrants from Singapore (25.8%, a difference of 0.47%), and Immigrants from Eastern Asia (26.1%, a difference of 0.61%).
DemographicsRating | RankSingle Mother Poverty
Immigrants | Lithuania
100.0
/100
|
#9
Exceptional
25.2%
Immigrants | South Central Asia
100.0
/100
|
#10
Exceptional
25.3%
Iranians
100.0
/100
|
#11
Exceptional
25.5%
Bhutanese
100.0
/100
|
#12
Exceptional
25.6%
Indians (Asian)
100.0
/100
|
#13
Exceptional
25.8%
Immigrants | Singapore
100.0
/100
|
#14
Exceptional
25.8%
Immigrants | Ireland
100.0
/100
|
#15
Exceptional
25.8%
Bolivians
100.0
/100
|
#16
Exceptional
25.9%
Asians
100.0
/100
|
#17
Exceptional
26.0%
Immigrants | Pakistan
100.0
/100
|
#18
Exceptional
26.0%
Immigrants | Eastern Asia
100.0
/100
|
#19
Exceptional
26.1%
Immigrants | China
100.0
/100
|
#20
Exceptional
26.1%
Immigrants | Bolivia
100.0
/100
|
#21
Exceptional
26.2%
Immigrants | Korea
100.0
/100
|
#22
Exceptional
26.2%
Burmese
100.0
/100
|
#23
Exceptional
26.2%