Iranian vs Immigrants from Iran Seniors Poverty Over the Age of 75
COMPARE
Iranian
Immigrants from Iran
Seniors Poverty Over the Age of 75
Seniors Poverty Over the Age of 75 Comparison
Iranians
Immigrants from Iran
11.5%
SENIORS POVERTY OVER THE AGE OF 75
95.1/ 100
METRIC RATING
82nd/ 347
METRIC RANK
12.2%
SENIORS POVERTY OVER THE AGE OF 75
48.1/ 100
METRIC RATING
176th/ 347
METRIC RANK
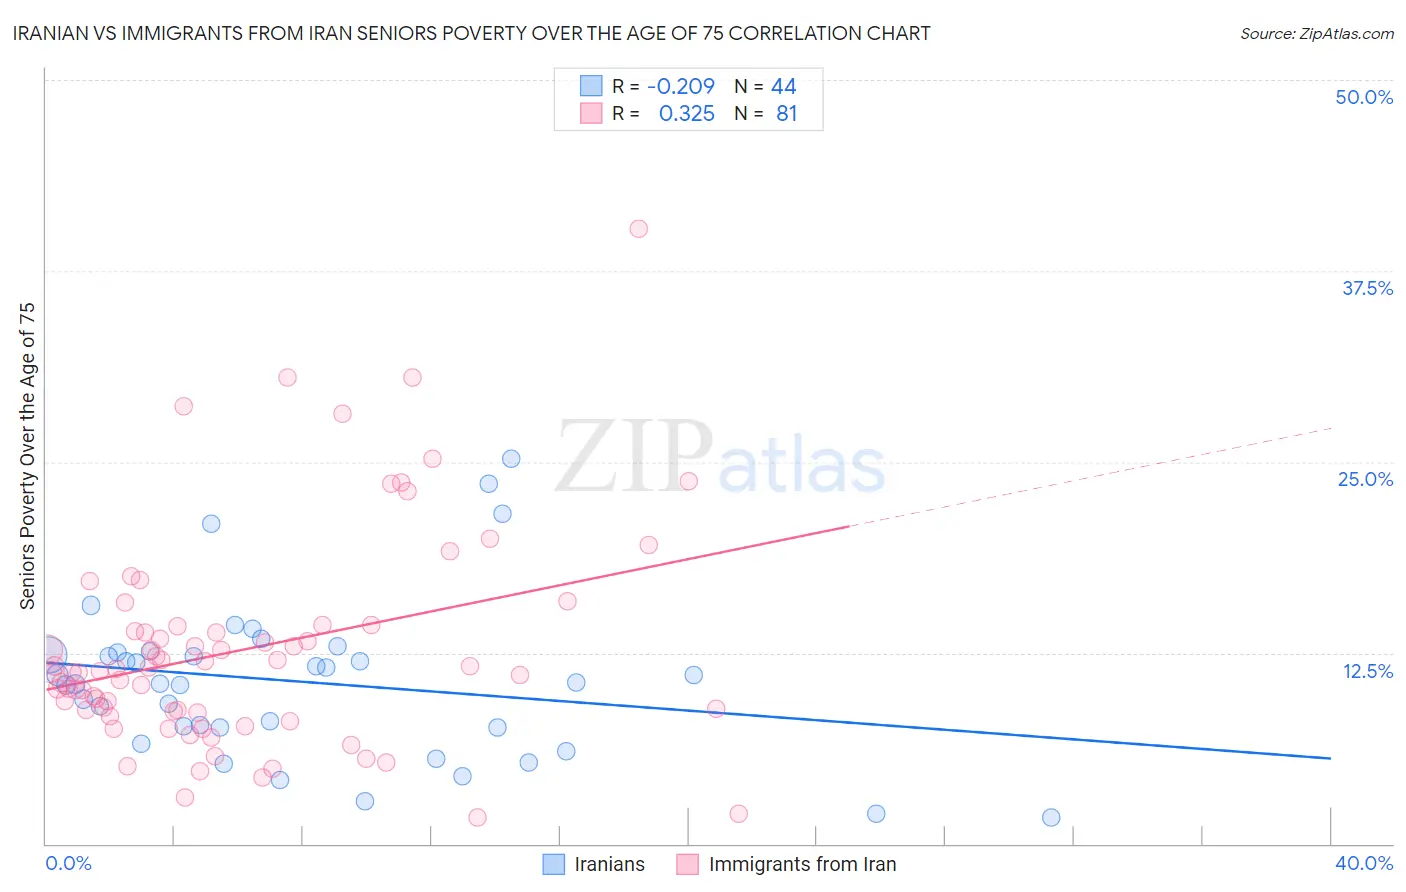
Iranian vs Immigrants from Iran Seniors Poverty Over the Age of 75 Correlation Chart
The statistical analysis conducted on geographies consisting of 314,002,652 people shows a weak negative correlation between the proportion of Iranians and poverty level among seniors over the age of 75 in the United States with a correlation coefficient (R) of -0.209 and weighted average of 11.5%. Similarly, the statistical analysis conducted on geographies consisting of 277,768,915 people shows a mild positive correlation between the proportion of Immigrants from Iran and poverty level among seniors over the age of 75 in the United States with a correlation coefficient (R) of 0.325 and weighted average of 12.2%, a difference of 6.6%.
Seniors Poverty Over the Age of 75 Correlation Summary
| Measurement | Iranian | Immigrants from Iran |
| Minimum | 1.7% | 1.7% |
| Maximum | 25.2% | 40.3% |
| Range | 23.4% | 38.6% |
| Mean | 10.6% | 12.7% |
| Median | 10.5% | 11.3% |
| Interquartile 25% (IQ1) | 7.6% | 8.6% |
| Interquartile 75% (IQ3) | 12.4% | 14.3% |
| Interquartile Range (IQR) | 4.8% | 5.7% |
| Standard Deviation (Sample) | 5.2% | 7.0% |
| Standard Deviation (Population) | 5.1% | 7.0% |
Similar Demographics by Seniors Poverty Over the Age of 75
Demographics Similar to Iranians by Seniors Poverty Over the Age of 75
In terms of seniors poverty over the age of 75, the demographic groups most similar to Iranians are Basque (11.5%, a difference of 0.010%), Immigrants from South Africa (11.5%, a difference of 0.080%), Immigrants from Iraq (11.5%, a difference of 0.090%), Alaska Native (11.4%, a difference of 0.13%), and Macedonian (11.4%, a difference of 0.19%).
| Demographics | Rating | Rank | Seniors Poverty Over the Age of 75 |
| Palestinians | 95.8 /100 | #75 | Exceptional 11.4% |
| French Canadians | 95.7 /100 | #76 | Exceptional 11.4% |
| Whites/Caucasians | 95.5 /100 | #77 | Exceptional 11.4% |
| Macedonians | 95.5 /100 | #78 | Exceptional 11.4% |
| Filipinos | 95.5 /100 | #79 | Exceptional 11.4% |
| Alaska Natives | 95.4 /100 | #80 | Exceptional 11.4% |
| Basques | 95.1 /100 | #81 | Exceptional 11.5% |
| Iranians | 95.1 /100 | #82 | Exceptional 11.5% |
| Immigrants | South Africa | 94.9 /100 | #83 | Exceptional 11.5% |
| Immigrants | Iraq | 94.9 /100 | #84 | Exceptional 11.5% |
| Immigrants | Bulgaria | 94.7 /100 | #85 | Exceptional 11.5% |
| Australians | 94.6 /100 | #86 | Exceptional 11.5% |
| Koreans | 94.5 /100 | #87 | Exceptional 11.5% |
| Immigrants | Croatia | 94.5 /100 | #88 | Exceptional 11.5% |
| Immigrants | Sri Lanka | 94.4 /100 | #89 | Exceptional 11.5% |
Demographics Similar to Immigrants from Iran by Seniors Poverty Over the Age of 75
In terms of seniors poverty over the age of 75, the demographic groups most similar to Immigrants from Iran are Immigrants from Asia (12.2%, a difference of 0.020%), Nonimmigrants (12.2%, a difference of 0.10%), Immigrants from Saudi Arabia (12.2%, a difference of 0.11%), Immigrants from Europe (12.2%, a difference of 0.16%), and Arab (12.2%, a difference of 0.19%).
| Demographics | Rating | Rank | Seniors Poverty Over the Age of 75 |
| Immigrants | Egypt | 53.7 /100 | #169 | Average 12.2% |
| Immigrants | Thailand | 52.0 /100 | #170 | Average 12.2% |
| Spaniards | 51.6 /100 | #171 | Average 12.2% |
| Immigrants | Fiji | 51.5 /100 | #172 | Average 12.2% |
| Arabs | 50.5 /100 | #173 | Average 12.2% |
| Immigrants | Europe | 50.0 /100 | #174 | Average 12.2% |
| Immigrants | Saudi Arabia | 49.5 /100 | #175 | Average 12.2% |
| Immigrants | Iran | 48.1 /100 | #176 | Average 12.2% |
| Immigrants | Asia | 47.8 /100 | #177 | Average 12.2% |
| Immigrants | Nonimmigrants | 46.8 /100 | #178 | Average 12.2% |
| Mongolians | 45.5 /100 | #179 | Average 12.2% |
| Immigrants | South Eastern Asia | 44.3 /100 | #180 | Average 12.2% |
| Immigrants | Australia | 44.2 /100 | #181 | Average 12.2% |
| German Russians | 41.4 /100 | #182 | Average 12.3% |
| Laotians | 38.2 /100 | #183 | Fair 12.3% |