Inupiat vs Ute Poverty
COMPARE
Inupiat
Ute
Poverty
Poverty Comparison
Inupiat
Ute
15.1%
POVERTY
0.0/ 100
METRIC RATING
287th/ 347
METRIC RANK
16.9%
POVERTY
0.0/ 100
METRIC RATING
328th/ 347
METRIC RANK
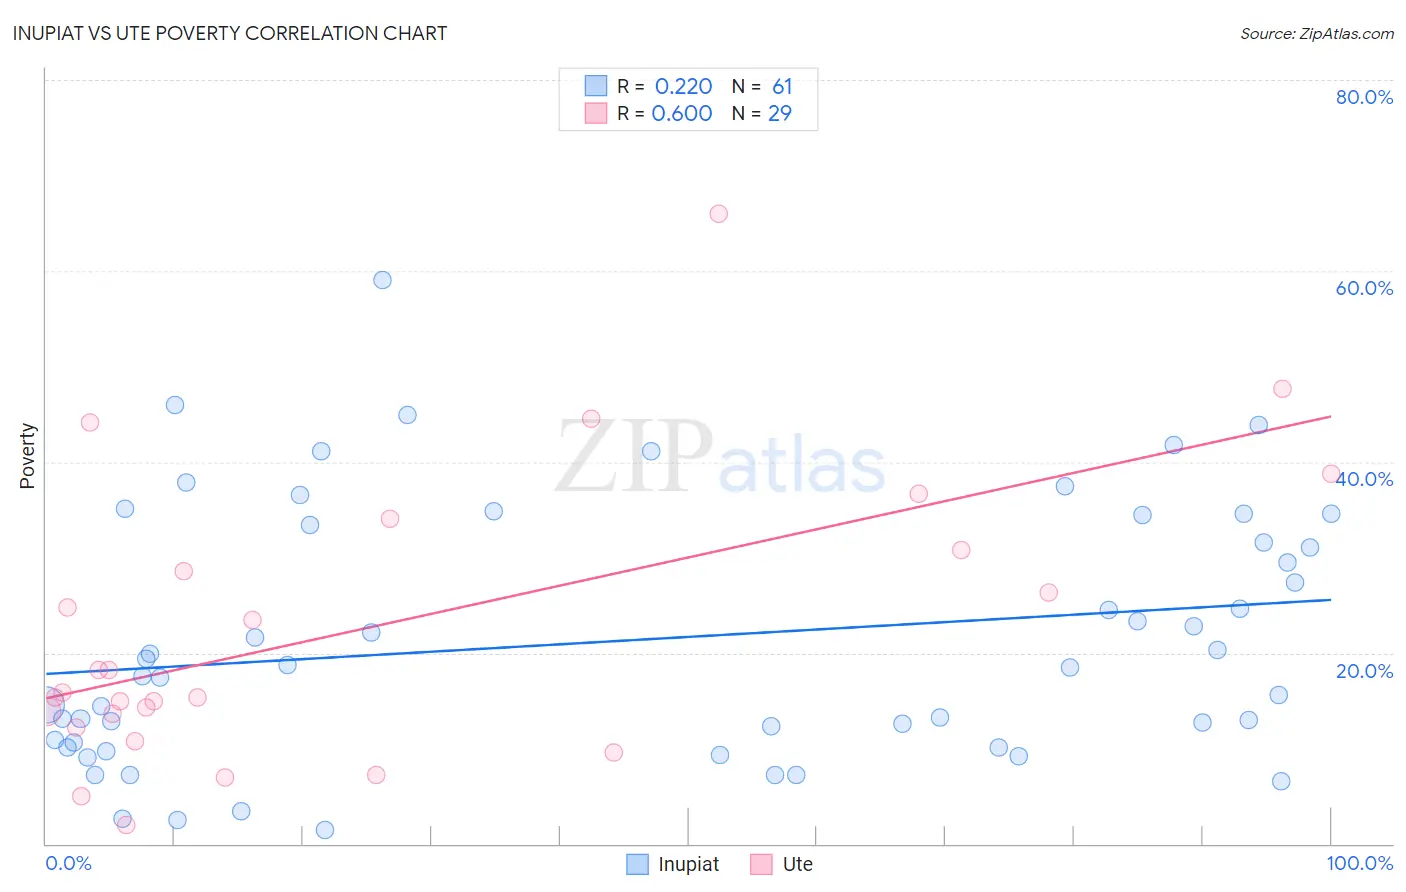
Inupiat vs Ute Poverty Correlation Chart
The statistical analysis conducted on geographies consisting of 96,319,332 people shows a weak positive correlation between the proportion of Inupiat and poverty level in the United States with a correlation coefficient (R) of 0.220 and weighted average of 15.1%. Similarly, the statistical analysis conducted on geographies consisting of 55,667,697 people shows a significant positive correlation between the proportion of Ute and poverty level in the United States with a correlation coefficient (R) of 0.600 and weighted average of 16.9%, a difference of 12.2%.
Poverty Correlation Summary
| Measurement | Inupiat | Ute |
| Minimum | 1.4% | 2.0% |
| Maximum | 59.1% | 66.0% |
| Range | 57.7% | 64.0% |
| Mean | 21.3% | 22.6% |
| Median | 18.4% | 15.9% |
| Interquartile 25% (IQ1) | 10.3% | 12.9% |
| Interquartile 75% (IQ3) | 33.9% | 32.4% |
| Interquartile Range (IQR) | 23.5% | 19.5% |
| Standard Deviation (Sample) | 13.3% | 15.0% |
| Standard Deviation (Population) | 13.2% | 14.8% |
Similar Demographics by Poverty
Demographics Similar to Inupiat by Poverty
In terms of poverty, the demographic groups most similar to Inupiat are Yaqui (15.1%, a difference of 0.010%), Immigrants from Belize (15.1%, a difference of 0.13%), Immigrants from Latin America (15.0%, a difference of 0.21%), Mexican (15.1%, a difference of 0.23%), and Immigrants from Cabo Verde (15.1%, a difference of 0.36%).
| Demographics | Rating | Rank | Poverty |
| Haitians | 0.0 /100 | #280 | Tragic 14.9% |
| Immigrants | Barbados | 0.0 /100 | #281 | Tragic 14.9% |
| Comanche | 0.0 /100 | #282 | Tragic 15.0% |
| Immigrants | Haiti | 0.0 /100 | #283 | Tragic 15.0% |
| West Indians | 0.0 /100 | #284 | Tragic 15.0% |
| Vietnamese | 0.0 /100 | #285 | Tragic 15.0% |
| Immigrants | Latin America | 0.0 /100 | #286 | Tragic 15.0% |
| Inupiat | 0.0 /100 | #287 | Tragic 15.1% |
| Yaqui | 0.0 /100 | #288 | Tragic 15.1% |
| Immigrants | Belize | 0.0 /100 | #289 | Tragic 15.1% |
| Mexicans | 0.0 /100 | #290 | Tragic 15.1% |
| Immigrants | Cabo Verde | 0.0 /100 | #291 | Tragic 15.1% |
| Indonesians | 0.0 /100 | #292 | Tragic 15.1% |
| Immigrants | Zaire | 0.0 /100 | #293 | Tragic 15.1% |
| Blackfeet | 0.0 /100 | #294 | Tragic 15.2% |
Demographics Similar to Ute by Poverty
In terms of poverty, the demographic groups most similar to Ute are Kiowa (16.8%, a difference of 0.43%), Paiute (16.7%, a difference of 0.96%), Central American Indian (16.7%, a difference of 1.3%), Yakama (16.7%, a difference of 1.5%), and Colville (16.6%, a difference of 2.0%).
| Demographics | Rating | Rank | Poverty |
| Arapaho | 0.0 /100 | #321 | Tragic 16.3% |
| Menominee | 0.0 /100 | #322 | Tragic 16.4% |
| Colville | 0.0 /100 | #323 | Tragic 16.6% |
| Yakama | 0.0 /100 | #324 | Tragic 16.7% |
| Central American Indians | 0.0 /100 | #325 | Tragic 16.7% |
| Paiute | 0.0 /100 | #326 | Tragic 16.7% |
| Kiowa | 0.0 /100 | #327 | Tragic 16.8% |
| Ute | 0.0 /100 | #328 | Tragic 16.9% |
| Blacks/African Americans | 0.0 /100 | #329 | Tragic 17.3% |
| Dominicans | 0.0 /100 | #330 | Tragic 17.6% |
| Immigrants | Dominican Republic | 0.0 /100 | #331 | Tragic 17.8% |
| Natives/Alaskans | 0.0 /100 | #332 | Tragic 18.1% |
| Houma | 0.0 /100 | #333 | Tragic 18.4% |
| Apache | 0.0 /100 | #334 | Tragic 18.4% |
| Cheyenne | 0.0 /100 | #335 | Tragic 18.9% |