Indian (Asian) vs Immigrants from Ethiopia Single Father Poverty
COMPARE
Indian (Asian)
Immigrants from Ethiopia
Single Father Poverty
Single Father Poverty Comparison
Indians (Asian)
Immigrants from Ethiopia
14.8%
SINGLE FATHER POVERTY
100.0/ 100
METRIC RATING
41st/ 347
METRIC RANK
13.4%
SINGLE FATHER POVERTY
100.0/ 100
METRIC RATING
5th/ 347
METRIC RANK
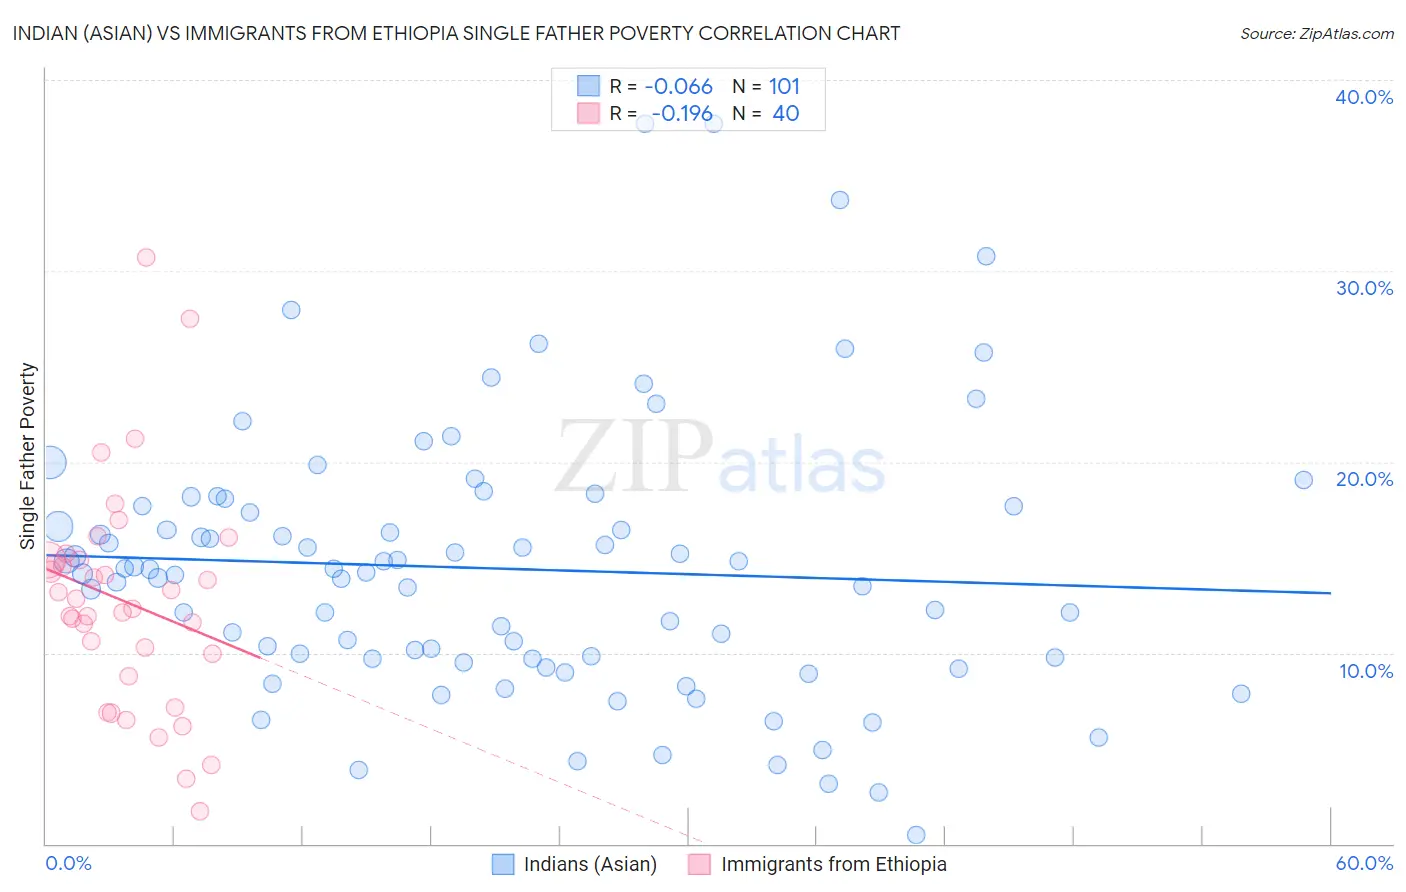
Indian (Asian) vs Immigrants from Ethiopia Single Father Poverty Correlation Chart
The statistical analysis conducted on geographies consisting of 373,368,189 people shows a slight negative correlation between the proportion of Indians (Asian) and poverty level among single fathers in the United States with a correlation coefficient (R) of -0.066 and weighted average of 14.8%. Similarly, the statistical analysis conducted on geographies consisting of 182,435,040 people shows a poor negative correlation between the proportion of Immigrants from Ethiopia and poverty level among single fathers in the United States with a correlation coefficient (R) of -0.196 and weighted average of 13.4%, a difference of 10.0%.
Single Father Poverty Correlation Summary
| Measurement | Indian (Asian) | Immigrants from Ethiopia |
| Minimum | 0.43% | 1.7% |
| Maximum | 37.7% | 30.7% |
| Range | 37.3% | 29.0% |
| Mean | 14.4% | 12.7% |
| Median | 14.2% | 12.6% |
| Interquartile 25% (IQ1) | 9.7% | 9.4% |
| Interquartile 75% (IQ3) | 17.7% | 14.9% |
| Interquartile Range (IQR) | 8.0% | 5.5% |
| Standard Deviation (Sample) | 7.1% | 5.8% |
| Standard Deviation (Population) | 7.0% | 5.8% |
Similar Demographics by Single Father Poverty
Demographics Similar to Indians (Asian) by Single Father Poverty
In terms of single father poverty, the demographic groups most similar to Indians (Asian) are Immigrants from Nepal (14.8%, a difference of 0.0%), Immigrants from Eritrea (14.8%, a difference of 0.040%), Pima (14.8%, a difference of 0.17%), Immigrants from Asia (14.7%, a difference of 0.37%), and Bolivian (14.7%, a difference of 0.54%).
| Demographics | Rating | Rank | Single Father Poverty |
| Egyptians | 100.0 /100 | #34 | Exceptional 14.7% |
| Immigrants | Bolivia | 100.0 /100 | #35 | Exceptional 14.7% |
| Immigrants | Indonesia | 100.0 /100 | #36 | Exceptional 14.7% |
| Immigrants | Eastern Africa | 100.0 /100 | #37 | Exceptional 14.7% |
| Bolivians | 100.0 /100 | #38 | Exceptional 14.7% |
| Immigrants | Asia | 100.0 /100 | #39 | Exceptional 14.7% |
| Pima | 100.0 /100 | #40 | Exceptional 14.8% |
| Indians (Asian) | 100.0 /100 | #41 | Exceptional 14.8% |
| Immigrants | Nepal | 100.0 /100 | #42 | Exceptional 14.8% |
| Immigrants | Eritrea | 100.0 /100 | #43 | Exceptional 14.8% |
| Salvadorans | 100.0 /100 | #44 | Exceptional 14.9% |
| Immigrants | Somalia | 100.0 /100 | #45 | Exceptional 14.9% |
| Immigrants | Cambodia | 99.9 /100 | #46 | Exceptional 14.9% |
| Immigrants | China | 99.9 /100 | #47 | Exceptional 14.9% |
| Malaysians | 99.9 /100 | #48 | Exceptional 14.9% |
Demographics Similar to Immigrants from Ethiopia by Single Father Poverty
In terms of single father poverty, the demographic groups most similar to Immigrants from Ethiopia are Ethiopian (13.5%, a difference of 0.77%), Immigrants from Fiji (13.2%, a difference of 1.6%), Immigrants from Taiwan (13.7%, a difference of 1.8%), Samoan (13.8%, a difference of 2.7%), and Afghan (14.0%, a difference of 3.8%).
| Demographics | Rating | Rank | Single Father Poverty |
| Assyrians/Chaldeans/Syriacs | 100.0 /100 | #1 | Exceptional 11.7% |
| Tongans | 100.0 /100 | #2 | Exceptional 12.2% |
| Tsimshian | 100.0 /100 | #3 | Exceptional 12.7% |
| Immigrants | Fiji | 100.0 /100 | #4 | Exceptional 13.2% |
| Immigrants | Ethiopia | 100.0 /100 | #5 | Exceptional 13.4% |
| Ethiopians | 100.0 /100 | #6 | Exceptional 13.5% |
| Immigrants | Taiwan | 100.0 /100 | #7 | Exceptional 13.7% |
| Samoans | 100.0 /100 | #8 | Exceptional 13.8% |
| Afghans | 100.0 /100 | #9 | Exceptional 14.0% |
| Koreans | 100.0 /100 | #10 | Exceptional 14.0% |
| Filipinos | 100.0 /100 | #11 | Exceptional 14.0% |
| Immigrants | India | 100.0 /100 | #12 | Exceptional 14.0% |
| Immigrants | Philippines | 100.0 /100 | #13 | Exceptional 14.0% |
| Immigrants | Vietnam | 100.0 /100 | #14 | Exceptional 14.1% |
| Sri Lankans | 100.0 /100 | #15 | Exceptional 14.2% |