Indian (Asian) vs Immigrants from Albania Seniors Poverty Over the Age of 75

COMPARE

Indian (Asian)
Race
Ancestry
AfghanAfricanAlaska NativeAlaskan AthabascanAlbanianAleutAlsatianAmericanApacheArabArapahoArgentineanArmenianAssyrian/Chaldean/SyriacAustralianAustrianBahamianBangladeshiBarbadianBasqueBelgianBelizeanBermudanBhutaneseBlackfeetBolivianBrazilianBritishBritish West IndianBulgarianBurmeseCajunCambodianCanadianCape VerdeanCarpatho RusynCelticCentral AmericanCentral American IndianCherokeeCheyenneChickasawChileanChineseChippewaChoctawColombianColvilleComancheCosta RicanCreeCreekCroatianCrowCubanCypriotCzechCzechoslovakianDanishDelawareDominicanDutchDutch West IndianEastern EuropeanEcuadorianEgyptianEnglishEstonianEthiopianEuropeanFijianFilipinoFinnishFrenchFrench American IndianFrench CanadianGermanGerman RussianGhanaianGreekGuamanian/ChamorroGuatemalanGuyaneseHaitianHmongHonduranHopiHoumaHungarianIcelanderIndian (Asian)IndonesianInupiatIranianIraqiIrishIroquoisIsraeliItalianJamaicanJapaneseJordanianKenyanKiowaKoreanLaotianLatvianLebaneseLiberianLithuanianLumbeeLuxembourgerMacedonianMalaysianMalteseMarshalleseMenomineeMexicanMexican American IndianMongolianMoroccanNative HawaiianNavajoNepaleseNew ZealanderNicaraguanNigerianNorthern EuropeanNorwegianOkinawanOsageOttawaPaiutePakistaniPalestinianPanamanianParaguayanPennsylvania GermanPeruvianPimaPolishPortuguesePotawatomiPuebloPuerto RicanPuget Sound SalishRomanianRussianSalvadoranSamoanScandinavianScotch-IrishScottishSeminoleSenegaleseSerbianShoshoneSierra LeoneanSiouxSlavicSlovakSloveneSomaliSouth AfricanSouth AmericanSouth American IndianSoviet UnionSpaniardSpanishSpanish AmericanSpanish American IndianSri LankanSubsaharan AfricanSudaneseSwedishSwissSyrianTaiwaneseThaiTlingit-HaidaTohono O'OdhamTonganTrinidadian and TobagonianTsimshianTurkishU.S. Virgin IslanderUgandanUkrainianUruguayanUteVenezuelanVietnameseWelshWest IndianYakamaYaquiYugoslavianYumanYup'ikZimbabwean
Immigration
NonimmigrantsImmigrantsAfghanistanAfricaArgentinaArmeniaAsiaAustraliaAustriaBahamasBangladeshBarbadosBelarusBelgiumBelizeBoliviaBosnia and HerzegovinaBrazilBulgariaBurma/MyanmarCabo VerdeCambodiaCameroonCanadaCaribbeanCentral AmericaChileChinaColombiaCongoCosta RicaCroatiaCubaCzechoslovakiaDenmarkDominicaDominican RepublicEastern AfricaEastern AsiaEastern EuropeEcuadorEgyptEl SalvadorEnglandEritreaEthiopiaEuropeFijiFranceGermanyGhanaGreeceGrenadaGuatemalaGuyanaHaitiHondurasHong KongHungaryIndiaIndonesiaIranIraqIrelandIsraelItalyJamaicaJapanJordanKazakhstanKenyaKoreaKuwaitLaosLatin AmericaLatviaLebanonLiberiaLithuaniaMalaysiaMexicoMicronesiaMiddle AfricaMoldovaMoroccoNepalNetherlandsNicaraguaNigeriaNorth AmericaNorth MacedoniaNorthern AfricaNorthern EuropeNorwayOceaniaPakistanPanamaPeruPhilippinesPolandPortugalRomaniaRussiaSaudi ArabiaScotlandSenegalSerbiaSierra LeoneSingaporeSomaliaSouth AfricaSouth AmericaSouth Central AsiaSouth Eastern AsiaSouthern EuropeSpainSri LankaSt. Vincent and the GrenadinesSudanSwedenSwitzerlandSyriaTaiwanThailandTrinidad and TobagoTurkeyUgandaUkraineUruguayUzbekistanVenezuelaVietnamWest IndiesWestern AfricaWestern AsiaWestern EuropeYemenZaireZimbabweAzores
Immigrants from Albania
Race
Ancestry
AfghanAfricanAlaska NativeAlaskan AthabascanAlbanianAleutAlsatianAmericanApacheArabArapahoArgentineanArmenianAssyrian/Chaldean/SyriacAustralianAustrianBahamianBangladeshiBarbadianBasqueBelgianBelizeanBermudanBhutaneseBlackfeetBolivianBrazilianBritishBritish West IndianBulgarianBurmeseCajunCambodianCanadianCape VerdeanCarpatho RusynCelticCentral AmericanCentral American IndianCherokeeCheyenneChickasawChileanChineseChippewaChoctawColombianColvilleComancheCosta RicanCreeCreekCroatianCrowCubanCypriotCzechCzechoslovakianDanishDelawareDominicanDutchDutch West IndianEastern EuropeanEcuadorianEgyptianEnglishEstonianEthiopianEuropeanFijianFilipinoFinnishFrenchFrench American IndianFrench CanadianGermanGerman RussianGhanaianGreekGuamanian/ChamorroGuatemalanGuyaneseHaitianHmongHonduranHopiHoumaHungarianIcelanderIndonesianInupiatIranianIraqiIrishIroquoisIsraeliItalianJamaicanJapaneseJordanianKenyanKiowaKoreanLaotianLatvianLebaneseLiberianLithuanianLumbeeLuxembourgerMacedonianMalaysianMalteseMarshalleseMenomineeMexicanMexican American IndianMongolianMoroccanNative HawaiianNavajoNepaleseNew ZealanderNicaraguanNigerianNorthern EuropeanNorwegianOkinawanOsageOttawaPaiutePakistaniPalestinianPanamanianParaguayanPennsylvania GermanPeruvianPimaPolishPortuguesePotawatomiPuebloPuerto RicanPuget Sound SalishRomanianRussianSalvadoranSamoanScandinavianScotch-IrishScottishSeminoleSenegaleseSerbianShoshoneSierra LeoneanSiouxSlavicSlovakSloveneSomaliSouth AfricanSouth AmericanSouth American IndianSoviet UnionSpaniardSpanishSpanish AmericanSpanish American IndianSri LankanSubsaharan AfricanSudaneseSwedishSwissSyrianTaiwaneseThaiTlingit-HaidaTohono O'OdhamTonganTrinidadian and TobagonianTsimshianTurkishU.S. Virgin IslanderUgandanUkrainianUruguayanUteVenezuelanVietnameseWelshWest IndianYakamaYaquiYugoslavianYumanYup'ikZimbabwean
Immigration
NonimmigrantsImmigrantsAfghanistanAfricaAlbaniaArgentinaArmeniaAsiaAustraliaAustriaBahamasBangladeshBarbadosBelarusBelgiumBelizeBoliviaBosnia and HerzegovinaBrazilBulgariaBurma/MyanmarCabo VerdeCambodiaCameroonCanadaCaribbeanCentral AmericaChileChinaColombiaCongoCosta RicaCroatiaCubaCzechoslovakiaDenmarkDominicaDominican RepublicEastern AfricaEastern AsiaEastern EuropeEcuadorEgyptEl SalvadorEnglandEritreaEthiopiaEuropeFijiFranceGermanyGhanaGreeceGrenadaGuatemalaGuyanaHaitiHondurasHong KongHungaryIndiaIndonesiaIranIraqIrelandIsraelItalyJamaicaJapanJordanKazakhstanKenyaKoreaKuwaitLaosLatin AmericaLatviaLebanonLiberiaLithuaniaMalaysiaMexicoMicronesiaMiddle AfricaMoldovaMoroccoNepalNetherlandsNicaraguaNigeriaNorth AmericaNorth MacedoniaNorthern AfricaNorthern EuropeNorwayOceaniaPakistanPanamaPeruPhilippinesPolandPortugalRomaniaRussiaSaudi ArabiaScotlandSenegalSerbiaSierra LeoneSingaporeSomaliaSouth AfricaSouth AmericaSouth Central AsiaSouth Eastern AsiaSouthern EuropeSpainSri LankaSt. Vincent and the GrenadinesSudanSwedenSwitzerlandSyriaTaiwanThailandTrinidad and TobagoTurkeyUgandaUkraineUruguayUzbekistanVenezuelaVietnamWest IndiesWestern AfricaWestern AsiaWestern EuropeYemenZaireZimbabweAzores
Seniors Poverty Over the Age of 75
Income
Poverty
Unemployment
Labor Participation
Family Structure
Vehicle Availability
Education Level
Disability

Seniors Poverty Over the Age of 75 Comparison

Indians (Asian)

Immigrants from Albania

Tragic
Tragic
12.7%
SENIORS POVERTY OVER THE AGE OF 75
9.7/ 100
METRIC RATING
205th/ 347
METRIC RANK
13.6%
SENIORS POVERTY OVER THE AGE OF 75
0.3/ 100
METRIC RATING
249th/ 347
METRIC RANK

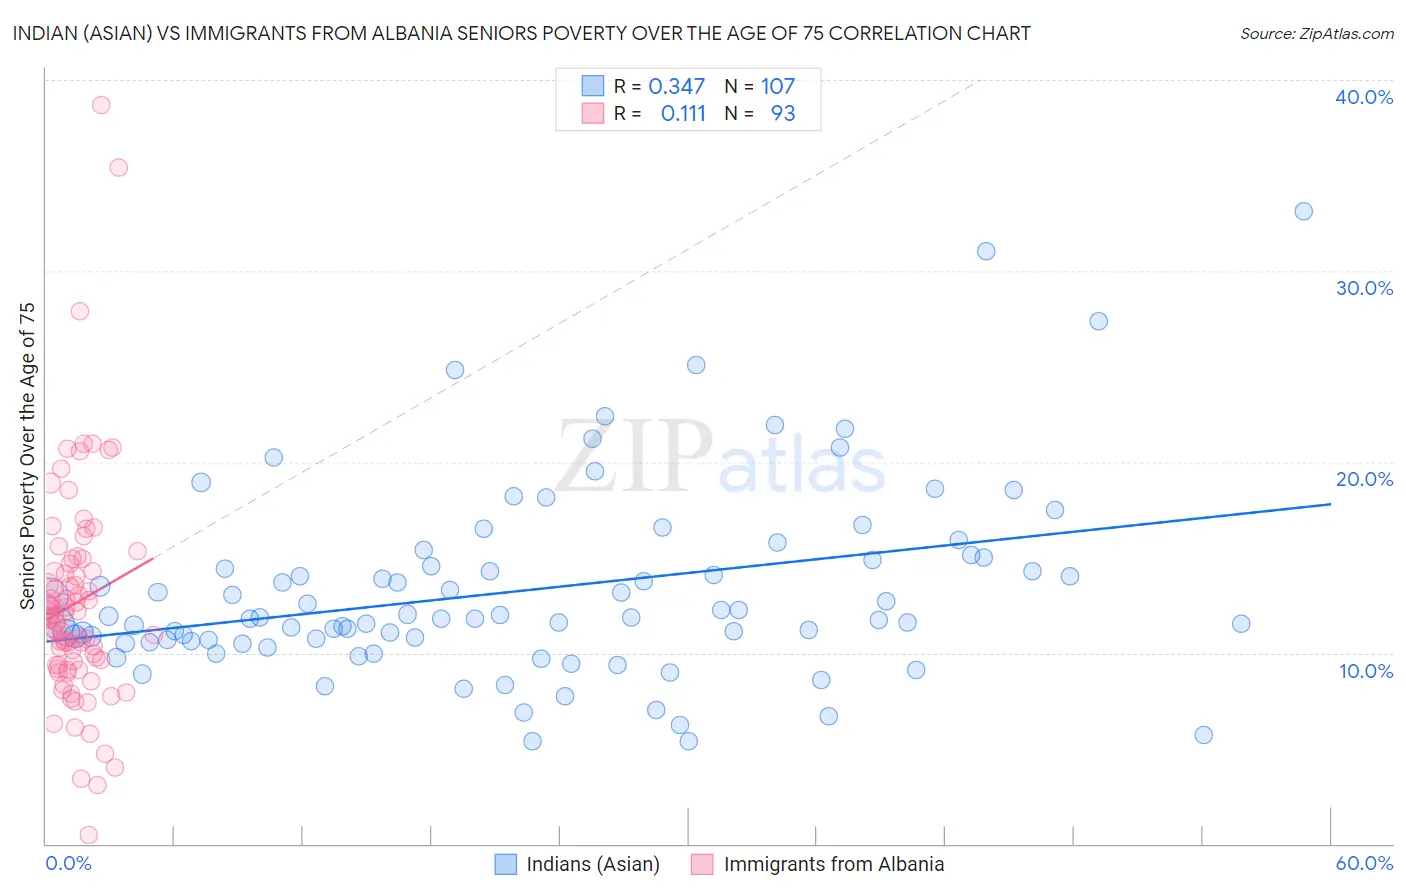
Indian (Asian) vs Immigrants from Albania Seniors Poverty Over the Age of 75 Correlation Chart

The statistical analysis conducted on geographies consisting of 486,315,330 people shows a mild positive correlation between the proportion of Indians (Asian) and poverty level among seniors over the age of 75 in the United States with a correlation coefficient (R) of 0.347 and weighted average of 12.7%. Similarly, the statistical analysis conducted on geographies consisting of 118,864,041 people shows a poor positive correlation between the proportion of Immigrants from Albania and poverty level among seniors over the age of 75 in the United States with a correlation coefficient (R) of 0.111 and weighted average of 13.6%, a difference of 6.8%.
Indian (Asian) vs Immigrants from Albania Seniors Poverty Over the Age of 75

Seniors Poverty Over the Age of 75 Correlation Summary

MeasurementIndian (Asian)Immigrants from Albania
Minimum5.3%0.46%
Maximum33.1%38.7%
Range27.8%38.2%
Mean13.3%12.6%
Median11.8%11.9%
Interquartile 25% (IQ1)10.6%9.3%
Interquartile 75% (IQ3)14.9%14.5%
Interquartile Range (IQR)4.2%5.1%
Standard Deviation (Sample)5.0%5.8%
Standard Deviation (Population)5.0%5.7%

Similar Demographics by Seniors Poverty Over the Age of 75

Demographics Similar to Indians (Asian) by Seniors Poverty Over the Age of 75

In terms of seniors poverty over the age of 75, the demographic groups most similar to Indians (Asian) are Albanian (12.7%, a difference of 0.040%), Immigrants from Eritrea (12.7%, a difference of 0.16%), Immigrants from Southern Europe (12.7%, a difference of 0.19%), Costa Rican (12.8%, a difference of 0.24%), and Arapaho (12.7%, a difference of 0.25%).
DemographicsRating | RankSeniors Poverty Over the Age of 75
Chileans
13.7
/100
|
#198
Poor
12.6%
Immigrants | Lebanon
12.7
/100
|
#199
Poor
12.7%
Immigrants | Vietnam
12.1
/100
|
#200
Poor
12.7%
Paraguayans
11.1
/100
|
#201
Poor
12.7%
Arapaho
10.9
/100
|
#202
Poor
12.7%
Immigrants | Southern Europe
10.7
/100
|
#203
Poor
12.7%
Immigrants | Eritrea
10.5
/100
|
#204
Poor
12.7%
Indians (Asian)
9.7
/100
|
#205
Tragic
12.7%
Albanians
9.6
/100
|
#206
Tragic
12.7%
Costa Ricans
8.7
/100
|
#207
Tragic
12.8%
Immigrants | Eastern Asia
8.4
/100
|
#208
Tragic
12.8%
Immigrants | Liberia
7.3
/100
|
#209
Tragic
12.8%
Comanche
7.0
/100
|
#210
Tragic
12.8%
Brazilians
6.9
/100
|
#211
Tragic
12.8%
Immigrants | Hong Kong
6.5
/100
|
#212
Tragic
12.8%

Demographics Similar to Immigrants from Albania by Seniors Poverty Over the Age of 75

In terms of seniors poverty over the age of 75, the demographic groups most similar to Immigrants from Albania are African (13.6%, a difference of 0.010%), Mexican American Indian (13.6%, a difference of 0.010%), Immigrants from Ukraine (13.6%, a difference of 0.040%), Immigrants from Peru (13.7%, a difference of 0.34%), and Immigrants from Argentina (13.7%, a difference of 0.39%).
DemographicsRating | RankSeniors Poverty Over the Age of 75
Immigrants | Somalia
0.6
/100
|
#242
Tragic
13.5%
Dutch West Indians
0.6
/100
|
#243
Tragic
13.5%
Spanish Americans
0.5
/100
|
#244
Tragic
13.5%
Uruguayans
0.5
/100
|
#245
Tragic
13.5%
Immigrants | Cambodia
0.4
/100
|
#246
Tragic
13.6%
Immigrants | Ukraine
0.3
/100
|
#247
Tragic
13.6%
Africans
0.3
/100
|
#248
Tragic
13.6%
Immigrants | Albania
0.3
/100
|
#249
Tragic
13.6%
Mexican American Indians
0.3
/100
|
#250
Tragic
13.6%
Immigrants | Peru
0.3
/100
|
#251
Tragic
13.7%
Immigrants | Argentina
0.3
/100
|
#252
Tragic
13.7%
Immigrants | Spain
0.2
/100
|
#253
Tragic
13.7%
Blackfeet
0.2
/100
|
#254
Tragic
13.7%
Immigrants | Belarus
0.2
/100
|
#255
Tragic
13.8%
Inupiat
0.1
/100
|
#256
Tragic
13.8%