Immigrants from Zimbabwe vs Belizean Child Poverty Among Boys Under 16

COMPARE

Immigrants from Zimbabwe
Race
Ancestry
AfghanAfricanAlaska NativeAlaskan AthabascanAlbanianAleutAlsatianAmericanApacheArabArapahoArgentineanArmenianAssyrian/Chaldean/SyriacAustralianAustrianBahamianBangladeshiBarbadianBasqueBelgianBermudanBhutaneseBlackfeetBolivianBrazilianBritishBritish West IndianBulgarianBurmeseCajunCambodianCanadianCape VerdeanCarpatho RusynCelticCentral AmericanCentral American IndianCherokeeCheyenneChickasawChileanChineseChippewaChoctawColombianColvilleComancheCosta RicanCreeCreekCroatianCrowCubanCypriotCzechCzechoslovakianDanishDelawareDominicanDutchDutch West IndianEastern EuropeanEcuadorianEgyptianEnglishEstonianEthiopianEuropeanFijianFilipinoFinnishFrenchFrench American IndianFrench CanadianGermanGerman RussianGhanaianGreekGuamanian/ChamorroGuatemalanGuyaneseHaitianHmongHonduranHopiHoumaHungarianIcelanderIndian (Asian)IndonesianInupiatIranianIraqiIrishIroquoisIsraeliItalianJamaicanJapaneseJordanianKenyanKiowaKoreanLaotianLatvianLebaneseLiberianLithuanianLumbeeLuxembourgerMacedonianMalaysianMalteseMarshalleseMenomineeMexicanMexican American IndianMongolianMoroccanNative HawaiianNavajoNepaleseNew ZealanderNicaraguanNigerianNorthern EuropeanNorwegianOkinawanOsageOttawaPaiutePakistaniPalestinianPanamanianParaguayanPennsylvania GermanPeruvianPimaPolishPortuguesePotawatomiPuebloPuerto RicanPuget Sound SalishRomanianRussianSalvadoranSamoanScandinavianScotch-IrishScottishSeminoleSenegaleseSerbianShoshoneSierra LeoneanSiouxSlavicSlovakSloveneSomaliSouth AfricanSouth AmericanSouth American IndianSoviet UnionSpaniardSpanishSpanish AmericanSpanish American IndianSri LankanSubsaharan AfricanSudaneseSwedishSwissSyrianTaiwaneseThaiTlingit-HaidaTohono O'OdhamTonganTrinidadian and TobagonianTsimshianTurkishU.S. Virgin IslanderUgandanUkrainianUruguayanUteVenezuelanVietnameseWelshWest IndianYakamaYaquiYugoslavianYumanYup'ikZimbabwean
Immigration
NonimmigrantsImmigrantsAfghanistanAfricaAlbaniaArgentinaArmeniaAsiaAustraliaAustriaBahamasBangladeshBarbadosBelarusBelgiumBelizeBoliviaBosnia and HerzegovinaBrazilBulgariaBurma/MyanmarCabo VerdeCambodiaCameroonCanadaCaribbeanCentral AmericaChileChinaColombiaCongoCosta RicaCroatiaCubaCzechoslovakiaDenmarkDominicaDominican RepublicEastern AfricaEastern AsiaEastern EuropeEcuadorEgyptEl SalvadorEnglandEritreaEthiopiaEuropeFijiFranceGermanyGhanaGreeceGrenadaGuatemalaGuyanaHaitiHondurasHong KongHungaryIndiaIndonesiaIranIraqIrelandIsraelItalyJamaicaJapanJordanKazakhstanKenyaKoreaKuwaitLaosLatin AmericaLatviaLebanonLiberiaLithuaniaMalaysiaMexicoMicronesiaMiddle AfricaMoldovaMoroccoNepalNetherlandsNicaraguaNigeriaNorth AmericaNorth MacedoniaNorthern AfricaNorthern EuropeNorwayOceaniaPakistanPanamaPeruPhilippinesPolandPortugalRomaniaRussiaSaudi ArabiaScotlandSenegalSerbiaSierra LeoneSingaporeSomaliaSouth AfricaSouth AmericaSouth Central AsiaSouth Eastern AsiaSouthern EuropeSpainSri LankaSt. Vincent and the GrenadinesSudanSwedenSwitzerlandSyriaTaiwanThailandTrinidad and TobagoTurkeyUgandaUkraineUruguayUzbekistanVenezuelaVietnamWest IndiesWestern AfricaWestern AsiaWestern EuropeYemenZaireZimbabweAzores
Belizean
Race
Ancestry
AfghanAfricanAlaska NativeAlaskan AthabascanAlbanianAleutAlsatianAmericanApacheArabArapahoArgentineanArmenianAssyrian/Chaldean/SyriacAustralianAustrianBahamianBangladeshiBarbadianBasqueBelgianBelizeanBermudanBhutaneseBlackfeetBolivianBrazilianBritishBritish West IndianBulgarianBurmeseCajunCambodianCanadianCape VerdeanCarpatho RusynCelticCentral AmericanCentral American IndianCherokeeCheyenneChickasawChileanChineseChippewaChoctawColombianColvilleComancheCosta RicanCreeCreekCroatianCrowCubanCypriotCzechCzechoslovakianDanishDelawareDominicanDutchDutch West IndianEastern EuropeanEcuadorianEgyptianEnglishEstonianEthiopianEuropeanFijianFilipinoFinnishFrenchFrench American IndianFrench CanadianGermanGerman RussianGhanaianGreekGuamanian/ChamorroGuatemalanGuyaneseHaitianHmongHonduranHopiHoumaHungarianIcelanderIndian (Asian)IndonesianInupiatIranianIraqiIrishIroquoisIsraeliItalianJamaicanJapaneseJordanianKenyanKiowaKoreanLaotianLatvianLebaneseLiberianLithuanianLumbeeLuxembourgerMacedonianMalaysianMalteseMarshalleseMenomineeMexicanMexican American IndianMongolianMoroccanNative HawaiianNavajoNepaleseNew ZealanderNicaraguanNigerianNorthern EuropeanNorwegianOkinawanOsageOttawaPaiutePakistaniPalestinianPanamanianParaguayanPennsylvania GermanPeruvianPimaPolishPortuguesePotawatomiPuebloPuerto RicanPuget Sound SalishRomanianRussianSalvadoranSamoanScandinavianScotch-IrishScottishSeminoleSenegaleseSerbianShoshoneSierra LeoneanSiouxSlavicSlovakSloveneSomaliSouth AfricanSouth AmericanSouth American IndianSoviet UnionSpaniardSpanishSpanish AmericanSpanish American IndianSri LankanSubsaharan AfricanSudaneseSwedishSwissSyrianTaiwaneseThaiTlingit-HaidaTohono O'OdhamTonganTrinidadian and TobagonianTsimshianTurkishU.S. Virgin IslanderUgandanUkrainianUruguayanUteVenezuelanVietnameseWelshWest IndianYakamaYaquiYugoslavianYumanYup'ikZimbabwean
Immigration
NonimmigrantsImmigrantsAfghanistanAfricaAlbaniaArgentinaArmeniaAsiaAustraliaAustriaBahamasBangladeshBarbadosBelarusBelgiumBelizeBoliviaBosnia and HerzegovinaBrazilBulgariaBurma/MyanmarCabo VerdeCambodiaCameroonCanadaCaribbeanCentral AmericaChileChinaColombiaCongoCosta RicaCroatiaCubaCzechoslovakiaDenmarkDominicaDominican RepublicEastern AfricaEastern AsiaEastern EuropeEcuadorEgyptEl SalvadorEnglandEritreaEthiopiaEuropeFijiFranceGermanyGhanaGreeceGrenadaGuatemalaGuyanaHaitiHondurasHong KongHungaryIndiaIndonesiaIranIraqIrelandIsraelItalyJamaicaJapanJordanKazakhstanKenyaKoreaKuwaitLaosLatin AmericaLatviaLebanonLiberiaLithuaniaMalaysiaMexicoMicronesiaMiddle AfricaMoldovaMoroccoNepalNetherlandsNicaraguaNigeriaNorth AmericaNorth MacedoniaNorthern AfricaNorthern EuropeNorwayOceaniaPakistanPanamaPeruPhilippinesPolandPortugalRomaniaRussiaSaudi ArabiaScotlandSenegalSerbiaSierra LeoneSingaporeSomaliaSouth AfricaSouth AmericaSouth Central AsiaSouth Eastern AsiaSouthern EuropeSpainSri LankaSt. Vincent and the GrenadinesSudanSwedenSwitzerlandSyriaTaiwanThailandTrinidad and TobagoTurkeyUgandaUkraineUruguayUzbekistanVenezuelaVietnamWest IndiesWestern AfricaWestern AsiaWestern EuropeYemenZaireAzores
Child Poverty Among Boys Under 16
Income
Poverty
Unemployment
Labor Participation
Family Structure
Vehicle Availability
Education Level
Disability

Child Poverty Among Boys Under 16 Comparison

Immigrants from Zimbabwe

Belizeans

Exceptional
Tragic
15.2%
CHILD POVERTY AMONG BOYS UNDER 16
94.2/ 100
METRIC RATING
111th/ 347
METRIC RANK
19.9%
CHILD POVERTY AMONG BOYS UNDER 16
0.1/ 100
METRIC RATING
273rd/ 347
METRIC RANK

Immigrants from Zimbabwe vs Belizean Child Poverty Among Boys Under 16 Correlation Chart

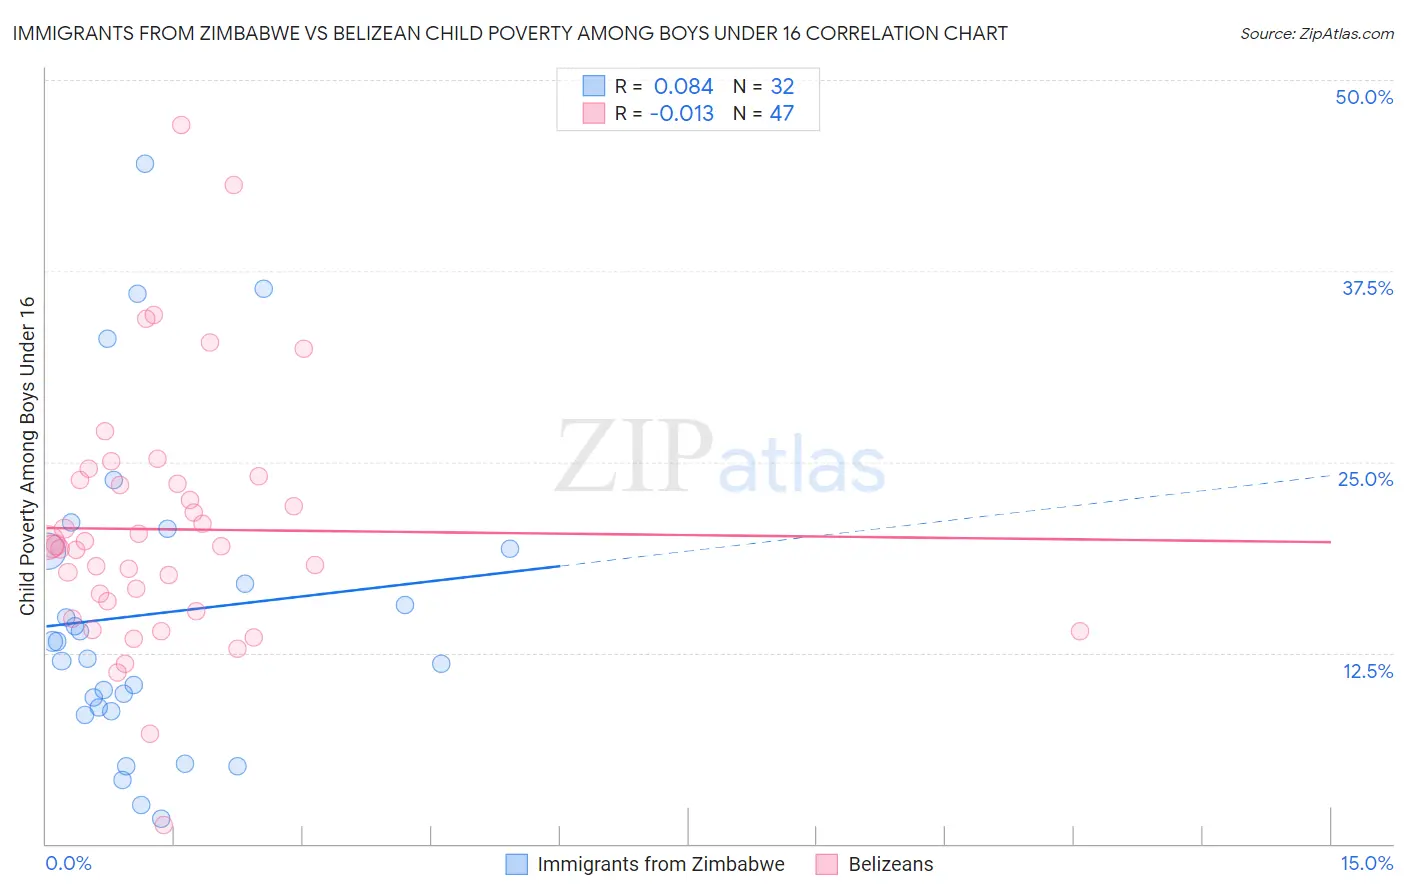
The statistical analysis conducted on geographies consisting of 117,351,792 people shows a slight positive correlation between the proportion of Immigrants from Zimbabwe and poverty level among boys under the age of 16 in the United States with a correlation coefficient (R) of 0.084 and weighted average of 15.2%. Similarly, the statistical analysis conducted on geographies consisting of 143,705,022 people shows no correlation between the proportion of Belizeans and poverty level among boys under the age of 16 in the United States with a correlation coefficient (R) of -0.013 and weighted average of 19.9%, a difference of 31.1%.
Immigrants from Zimbabwe vs Belizean Child Poverty Among Boys Under 16

Child Poverty Among Boys Under 16 Correlation Summary

MeasurementImmigrants from ZimbabweBelizean
Minimum1.6%1.2%
Maximum44.5%47.1%
Range42.9%45.9%
Mean15.0%20.6%
Median12.7%19.5%
Interquartile 25% (IQ1)8.8%15.2%
Interquartile 75% (IQ3)19.2%23.8%
Interquartile Range (IQR)10.4%8.6%
Standard Deviation (Sample)10.3%8.4%
Standard Deviation (Population)10.1%8.3%

Similar Demographics by Child Poverty Among Boys Under 16

Demographics Similar to Immigrants from Zimbabwe by Child Poverty Among Boys Under 16

In terms of child poverty among boys under 16, the demographic groups most similar to Immigrants from Zimbabwe are English (15.1%, a difference of 0.050%), Basque (15.2%, a difference of 0.20%), Irish (15.2%, a difference of 0.24%), Immigrants from Ukraine (15.2%, a difference of 0.29%), and Pakistani (15.1%, a difference of 0.31%).
DemographicsRating | RankChild Poverty Among Boys Under 16
Immigrants | Switzerland
95.4
/100
|
#104
Exceptional
15.0%
Dutch
95.4
/100
|
#105
Exceptional
15.0%
Serbians
95.2
/100
|
#106
Exceptional
15.1%
Jordanians
95.1
/100
|
#107
Exceptional
15.1%
Immigrants | England
94.8
/100
|
#108
Exceptional
15.1%
Pakistanis
94.7
/100
|
#109
Exceptional
15.1%
English
94.3
/100
|
#110
Exceptional
15.1%
Immigrants | Zimbabwe
94.2
/100
|
#111
Exceptional
15.2%
Basques
93.8
/100
|
#112
Exceptional
15.2%
Irish
93.8
/100
|
#113
Exceptional
15.2%
Immigrants | Ukraine
93.6
/100
|
#114
Exceptional
15.2%
Armenians
93.6
/100
|
#115
Exceptional
15.2%
Immigrants | South Eastern Asia
93.5
/100
|
#116
Exceptional
15.2%
Immigrants | Vietnam
93.5
/100
|
#117
Exceptional
15.2%
Native Hawaiians
93.4
/100
|
#118
Exceptional
15.2%

Demographics Similar to Belizeans by Child Poverty Among Boys Under 16

In terms of child poverty among boys under 16, the demographic groups most similar to Belizeans are Immigrants from Ecuador (19.8%, a difference of 0.14%), Immigrants from Bangladesh (19.9%, a difference of 0.25%), Chickasaw (19.8%, a difference of 0.36%), Jamaican (20.0%, a difference of 0.38%), and Subsaharan African (20.0%, a difference of 0.55%).
DemographicsRating | RankChild Poverty Among Boys Under 16
Immigrants | El Salvador
0.1
/100
|
#266
Tragic
19.6%
Vietnamese
0.1
/100
|
#267
Tragic
19.6%
Spanish American Indians
0.1
/100
|
#268
Tragic
19.6%
Immigrants | Cabo Verde
0.1
/100
|
#269
Tragic
19.7%
Cherokee
0.1
/100
|
#270
Tragic
19.7%
Chickasaw
0.1
/100
|
#271
Tragic
19.8%
Immigrants | Ecuador
0.1
/100
|
#272
Tragic
19.8%
Belizeans
0.1
/100
|
#273
Tragic
19.9%
Immigrants | Bangladesh
0.0
/100
|
#274
Tragic
19.9%
Jamaicans
0.0
/100
|
#275
Tragic
20.0%
Sub-Saharan Africans
0.0
/100
|
#276
Tragic
20.0%
Immigrants | Barbados
0.0
/100
|
#277
Tragic
20.0%
Immigrants | West Indies
0.0
/100
|
#278
Tragic
20.0%
Bangladeshis
0.0
/100
|
#279
Tragic
20.0%
Central Americans
0.0
/100
|
#280
Tragic
20.1%