Immigrants from Zaire vs Brazilian Child Poverty Among Boys Under 16
COMPARE
Immigrants from Zaire
Brazilian
Child Poverty Among Boys Under 16
Child Poverty Among Boys Under 16 Comparison
Immigrants from Zaire
Brazilians
20.1%
CHILD POVERTY AMONG BOYS UNDER 16
0.0/ 100
METRIC RATING
281st/ 347
METRIC RANK
15.8%
CHILD POVERTY AMONG BOYS UNDER 16
81.0/ 100
METRIC RATING
148th/ 347
METRIC RANK
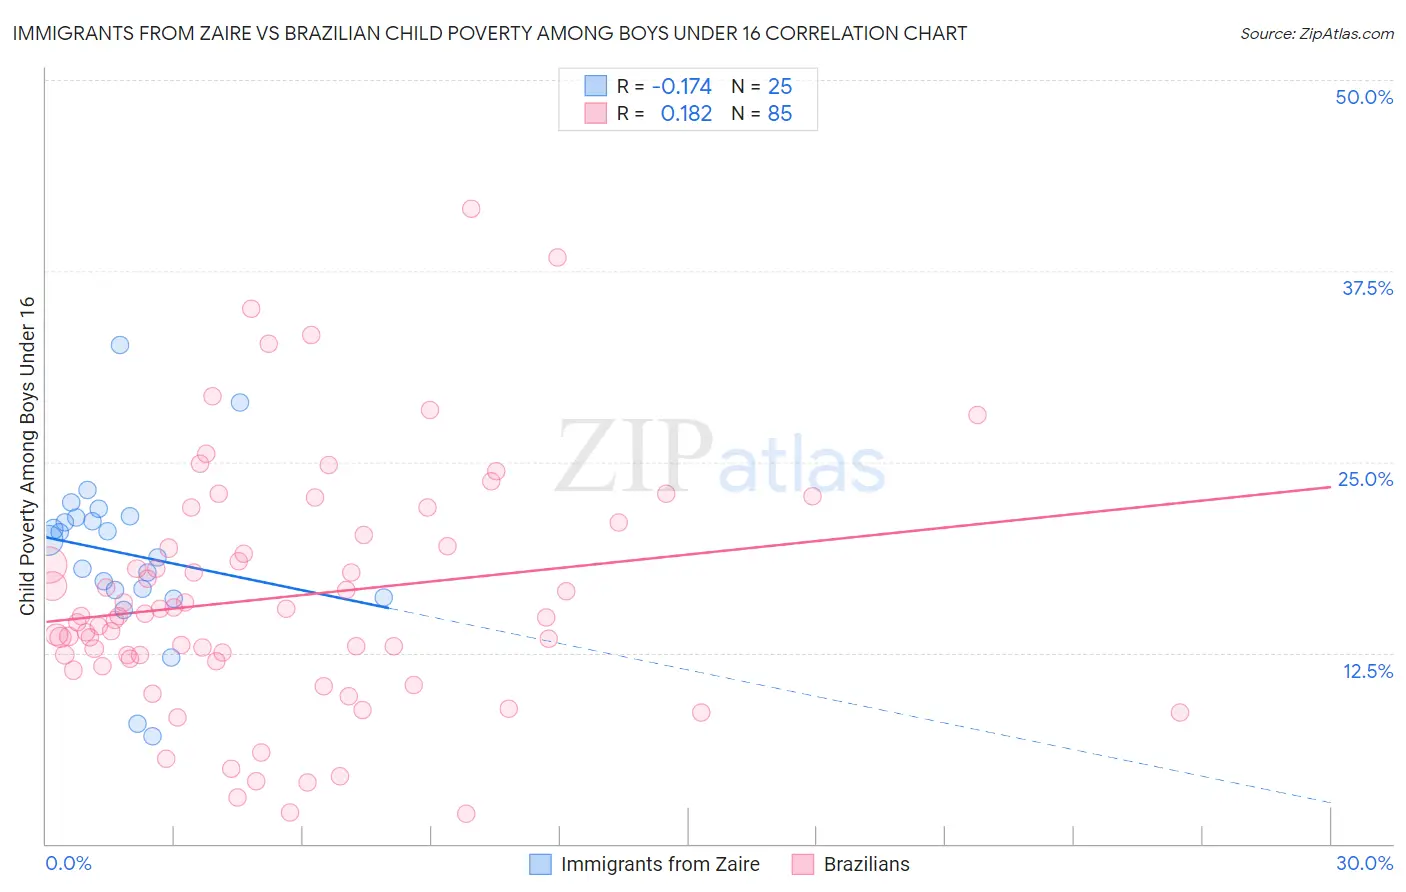
Immigrants from Zaire vs Brazilian Child Poverty Among Boys Under 16 Correlation Chart
The statistical analysis conducted on geographies consisting of 107,061,350 people shows a poor negative correlation between the proportion of Immigrants from Zaire and poverty level among boys under the age of 16 in the United States with a correlation coefficient (R) of -0.174 and weighted average of 20.1%. Similarly, the statistical analysis conducted on geographies consisting of 319,230,692 people shows a poor positive correlation between the proportion of Brazilians and poverty level among boys under the age of 16 in the United States with a correlation coefficient (R) of 0.182 and weighted average of 15.8%, a difference of 27.3%.
Child Poverty Among Boys Under 16 Correlation Summary
| Measurement | Immigrants from Zaire | Brazilian |
| Minimum | 7.0% | 1.9% |
| Maximum | 32.7% | 41.6% |
| Range | 25.6% | 39.6% |
| Mean | 19.0% | 16.2% |
| Median | 19.9% | 14.9% |
| Interquartile 25% (IQ1) | 16.4% | 12.1% |
| Interquartile 75% (IQ3) | 21.4% | 19.9% |
| Interquartile Range (IQR) | 5.1% | 7.8% |
| Standard Deviation (Sample) | 5.4% | 7.9% |
| Standard Deviation (Population) | 5.3% | 7.9% |
Similar Demographics by Child Poverty Among Boys Under 16
Demographics Similar to Immigrants from Zaire by Child Poverty Among Boys Under 16
In terms of child poverty among boys under 16, the demographic groups most similar to Immigrants from Zaire are Comanche (20.1%, a difference of 0.050%), Central American (20.1%, a difference of 0.060%), Bangladeshi (20.0%, a difference of 0.18%), Immigrants from Jamaica (20.1%, a difference of 0.18%), and Immigrants from West Indies (20.0%, a difference of 0.31%).
| Demographics | Rating | Rank | Child Poverty Among Boys Under 16 |
| Immigrants | Bangladesh | 0.0 /100 | #274 | Tragic 19.9% |
| Jamaicans | 0.0 /100 | #275 | Tragic 20.0% |
| Sub-Saharan Africans | 0.0 /100 | #276 | Tragic 20.0% |
| Immigrants | Barbados | 0.0 /100 | #277 | Tragic 20.0% |
| Immigrants | West Indies | 0.0 /100 | #278 | Tragic 20.0% |
| Bangladeshis | 0.0 /100 | #279 | Tragic 20.0% |
| Central Americans | 0.0 /100 | #280 | Tragic 20.1% |
| Immigrants | Zaire | 0.0 /100 | #281 | Tragic 20.1% |
| Comanche | 0.0 /100 | #282 | Tragic 20.1% |
| Immigrants | Jamaica | 0.0 /100 | #283 | Tragic 20.1% |
| Barbadians | 0.0 /100 | #284 | Tragic 20.2% |
| Arapaho | 0.0 /100 | #285 | Tragic 20.2% |
| West Indians | 0.0 /100 | #286 | Tragic 20.3% |
| Immigrants | Belize | 0.0 /100 | #287 | Tragic 20.3% |
| Immigrants | St. Vincent and the Grenadines | 0.0 /100 | #288 | Tragic 20.3% |
Demographics Similar to Brazilians by Child Poverty Among Boys Under 16
In terms of child poverty among boys under 16, the demographic groups most similar to Brazilians are Slovak (15.8%, a difference of 0.14%), Immigrants from Jordan (15.8%, a difference of 0.15%), Venezuelan (15.7%, a difference of 0.20%), Puget Sound Salish (15.8%, a difference of 0.23%), and New Zealander (15.7%, a difference of 0.27%).
| Demographics | Rating | Rank | Child Poverty Among Boys Under 16 |
| Slavs | 84.5 /100 | #141 | Excellent 15.7% |
| Immigrants | Hungary | 84.1 /100 | #142 | Excellent 15.7% |
| Immigrants | Fiji | 83.6 /100 | #143 | Excellent 15.7% |
| Immigrants | Peru | 83.5 /100 | #144 | Excellent 15.7% |
| Samoans | 83.2 /100 | #145 | Excellent 15.7% |
| New Zealanders | 82.4 /100 | #146 | Excellent 15.7% |
| Venezuelans | 82.1 /100 | #147 | Excellent 15.7% |
| Brazilians | 81.0 /100 | #148 | Excellent 15.8% |
| Slovaks | 80.3 /100 | #149 | Excellent 15.8% |
| Immigrants | Jordan | 80.2 /100 | #150 | Excellent 15.8% |
| Puget Sound Salish | 79.8 /100 | #151 | Good 15.8% |
| Immigrants | Venezuela | 79.5 /100 | #152 | Good 15.8% |
| French | 78.7 /100 | #153 | Good 15.8% |
| Syrians | 77.5 /100 | #154 | Good 15.9% |
| French Canadians | 76.6 /100 | #155 | Good 15.9% |