Immigrants from Yemen vs Tongan Child Poverty Among Girls Under 16

COMPARE

Immigrants from Yemen
Race
Ancestry
AfghanAfricanAlaska NativeAlaskan AthabascanAlbanianAleutAlsatianAmericanApacheArabArapahoArgentineanArmenianAssyrian/Chaldean/SyriacAustralianAustrianBahamianBangladeshiBarbadianBasqueBelgianBelizeanBermudanBhutaneseBlackfeetBolivianBrazilianBritishBritish West IndianBulgarianBurmeseCajunCambodianCanadianCape VerdeanCarpatho RusynCelticCentral AmericanCentral American IndianCherokeeCheyenneChickasawChileanChineseChippewaChoctawColombianColvilleComancheCosta RicanCreeCreekCroatianCrowCubanCypriotCzechCzechoslovakianDanishDelawareDominicanDutchDutch West IndianEastern EuropeanEcuadorianEgyptianEnglishEstonianEthiopianEuropeanFijianFilipinoFinnishFrenchFrench American IndianFrench CanadianGermanGerman RussianGhanaianGreekGuamanian/ChamorroGuatemalanGuyaneseHaitianHmongHonduranHopiHoumaHungarianIcelanderIndian (Asian)IndonesianInupiatIranianIraqiIrishIroquoisIsraeliItalianJamaicanJapaneseJordanianKenyanKiowaKoreanLaotianLatvianLebaneseLiberianLithuanianLumbeeLuxembourgerMacedonianMalaysianMalteseMarshalleseMenomineeMexicanMexican American IndianMongolianMoroccanNative HawaiianNavajoNepaleseNew ZealanderNicaraguanNigerianNorthern EuropeanNorwegianOkinawanOsageOttawaPaiutePakistaniPalestinianPanamanianParaguayanPennsylvania GermanPeruvianPimaPolishPortuguesePotawatomiPuebloPuerto RicanPuget Sound SalishRomanianRussianSalvadoranSamoanScandinavianScotch-IrishScottishSeminoleSenegaleseSerbianShoshoneSierra LeoneanSiouxSlavicSlovakSloveneSomaliSouth AfricanSouth AmericanSouth American IndianSoviet UnionSpaniardSpanishSpanish AmericanSpanish American IndianSri LankanSubsaharan AfricanSudaneseSwedishSwissSyrianTaiwaneseThaiTlingit-HaidaTohono O'OdhamTrinidadian and TobagonianTsimshianTurkishU.S. Virgin IslanderUgandanUkrainianUruguayanUteVenezuelanVietnameseWelshWest IndianYakamaYaquiYugoslavianYumanYup'ikZimbabwean
Immigration
NonimmigrantsImmigrantsAfghanistanAfricaAlbaniaArgentinaArmeniaAsiaAustraliaAustriaBahamasBangladeshBarbadosBelarusBelgiumBelizeBoliviaBosnia and HerzegovinaBrazilBulgariaBurma/MyanmarCabo VerdeCambodiaCameroonCanadaCaribbeanCentral AmericaChileChinaColombiaCongoCosta RicaCroatiaCubaCzechoslovakiaDenmarkDominicaDominican RepublicEastern AfricaEastern AsiaEastern EuropeEcuadorEgyptEl SalvadorEnglandEritreaEthiopiaEuropeFijiFranceGermanyGhanaGreeceGrenadaGuatemalaGuyanaHaitiHondurasHong KongHungaryIndiaIndonesiaIranIraqIrelandIsraelItalyJamaicaJapanJordanKazakhstanKenyaKoreaKuwaitLaosLatin AmericaLatviaLebanonLiberiaLithuaniaMalaysiaMexicoMicronesiaMiddle AfricaMoldovaMoroccoNepalNetherlandsNicaraguaNigeriaNorth AmericaNorth MacedoniaNorthern AfricaNorthern EuropeNorwayOceaniaPakistanPanamaPeruPhilippinesPolandPortugalRomaniaRussiaSaudi ArabiaScotlandSenegalSerbiaSierra LeoneSingaporeSomaliaSouth AfricaSouth AmericaSouth Central AsiaSouth Eastern AsiaSouthern EuropeSpainSri LankaSt. Vincent and the GrenadinesSudanSwedenSwitzerlandSyriaTaiwanThailandTrinidad and TobagoTurkeyUgandaUkraineUruguayUzbekistanVenezuelaVietnamWest IndiesWestern AfricaWestern AsiaWestern EuropeYemenZaireZimbabweAzores
Tongan
Race
Ancestry
AfghanAfricanAlaska NativeAlaskan AthabascanAlbanianAleutAlsatianAmericanApacheArabArapahoArgentineanArmenianAssyrian/Chaldean/SyriacAustralianAustrianBahamianBangladeshiBarbadianBasqueBelgianBelizeanBermudanBhutaneseBlackfeetBolivianBrazilianBritishBritish West IndianBulgarianBurmeseCajunCambodianCanadianCape VerdeanCarpatho RusynCelticCentral AmericanCentral American IndianCherokeeCheyenneChickasawChileanChineseChippewaChoctawColombianColvilleComancheCosta RicanCreeCreekCroatianCrowCubanCypriotCzechCzechoslovakianDanishDelawareDominicanDutchDutch West IndianEastern EuropeanEcuadorianEgyptianEnglishEstonianEthiopianEuropeanFijianFilipinoFinnishFrenchFrench American IndianFrench CanadianGermanGerman RussianGhanaianGreekGuamanian/ChamorroGuatemalanGuyaneseHaitianHmongHonduranHopiHoumaHungarianIcelanderIndian (Asian)IndonesianInupiatIranianIraqiIrishIroquoisIsraeliItalianJamaicanJapaneseJordanianKenyanKiowaKoreanLaotianLatvianLebaneseLiberianLithuanianLumbeeLuxembourgerMacedonianMalaysianMalteseMarshalleseMenomineeMexicanMexican American IndianMongolianMoroccanNative HawaiianNavajoNepaleseNew ZealanderNicaraguanNigerianNorthern EuropeanNorwegianOkinawanOsageOttawaPaiutePakistaniPalestinianPanamanianParaguayanPennsylvania GermanPeruvianPimaPolishPortuguesePotawatomiPuebloPuerto RicanPuget Sound SalishRomanianRussianSalvadoranSamoanScandinavianScotch-IrishScottishSeminoleSenegaleseSerbianShoshoneSierra LeoneanSiouxSlavicSlovakSloveneSomaliSouth AfricanSouth AmericanSouth American IndianSoviet UnionSpaniardSpanishSpanish AmericanSpanish American IndianSri LankanSubsaharan AfricanSudaneseSwedishSwissSyrianTaiwaneseThaiTlingit-HaidaTohono O'OdhamTonganTrinidadian and TobagonianTsimshianTurkishU.S. Virgin IslanderUgandanUkrainianUruguayanUteVenezuelanVietnameseWelshWest IndianYakamaYaquiYugoslavianYumanYup'ikZimbabwean
Immigration
NonimmigrantsImmigrantsAfghanistanAfricaAlbaniaArgentinaArmeniaAsiaAustraliaAustriaBahamasBangladeshBarbadosBelarusBelgiumBelizeBoliviaBosnia and HerzegovinaBrazilBulgariaBurma/MyanmarCabo VerdeCambodiaCameroonCanadaCaribbeanCentral AmericaChileChinaColombiaCongoCosta RicaCroatiaCubaCzechoslovakiaDenmarkDominicaDominican RepublicEastern AfricaEastern AsiaEastern EuropeEcuadorEgyptEl SalvadorEnglandEritreaEthiopiaEuropeFijiFranceGermanyGhanaGreeceGrenadaGuatemalaGuyanaHaitiHondurasHong KongHungaryIndiaIndonesiaIranIraqIrelandIsraelItalyJamaicaJapanJordanKazakhstanKenyaKoreaKuwaitLaosLatin AmericaLatviaLebanonLiberiaLithuaniaMalaysiaMexicoMicronesiaMiddle AfricaMoldovaMoroccoNepalNetherlandsNicaraguaNigeriaNorth AmericaNorth MacedoniaNorthern AfricaNorthern EuropeNorwayOceaniaPakistanPanamaPeruPhilippinesPolandPortugalRomaniaRussiaSaudi ArabiaScotlandSenegalSerbiaSierra LeoneSingaporeSomaliaSouth AfricaSouth AmericaSouth Central AsiaSouth Eastern AsiaSouthern EuropeSpainSri LankaSt. Vincent and the GrenadinesSudanSwedenSwitzerlandSyriaTaiwanThailandTrinidad and TobagoTurkeyUgandaUkraineUruguayUzbekistanVenezuelaVietnamWest IndiesWestern AfricaWestern AsiaWestern EuropeZaireZimbabweAzores
Child Poverty Among Girls Under 16
Income
Poverty
Unemployment
Labor Participation
Family Structure
Vehicle Availability
Education Level
Disability

Child Poverty Among Girls Under 16 Comparison

Immigrants from Yemen

Tongans

Tragic
Exceptional
29.5%
CHILD POVERTY AMONG GIRLS UNDER 16
0.0/ 100
METRIC RATING
343rd/ 347
METRIC RANK
13.6%
CHILD POVERTY AMONG GIRLS UNDER 16
99.8/ 100
METRIC RATING
28th/ 347
METRIC RANK

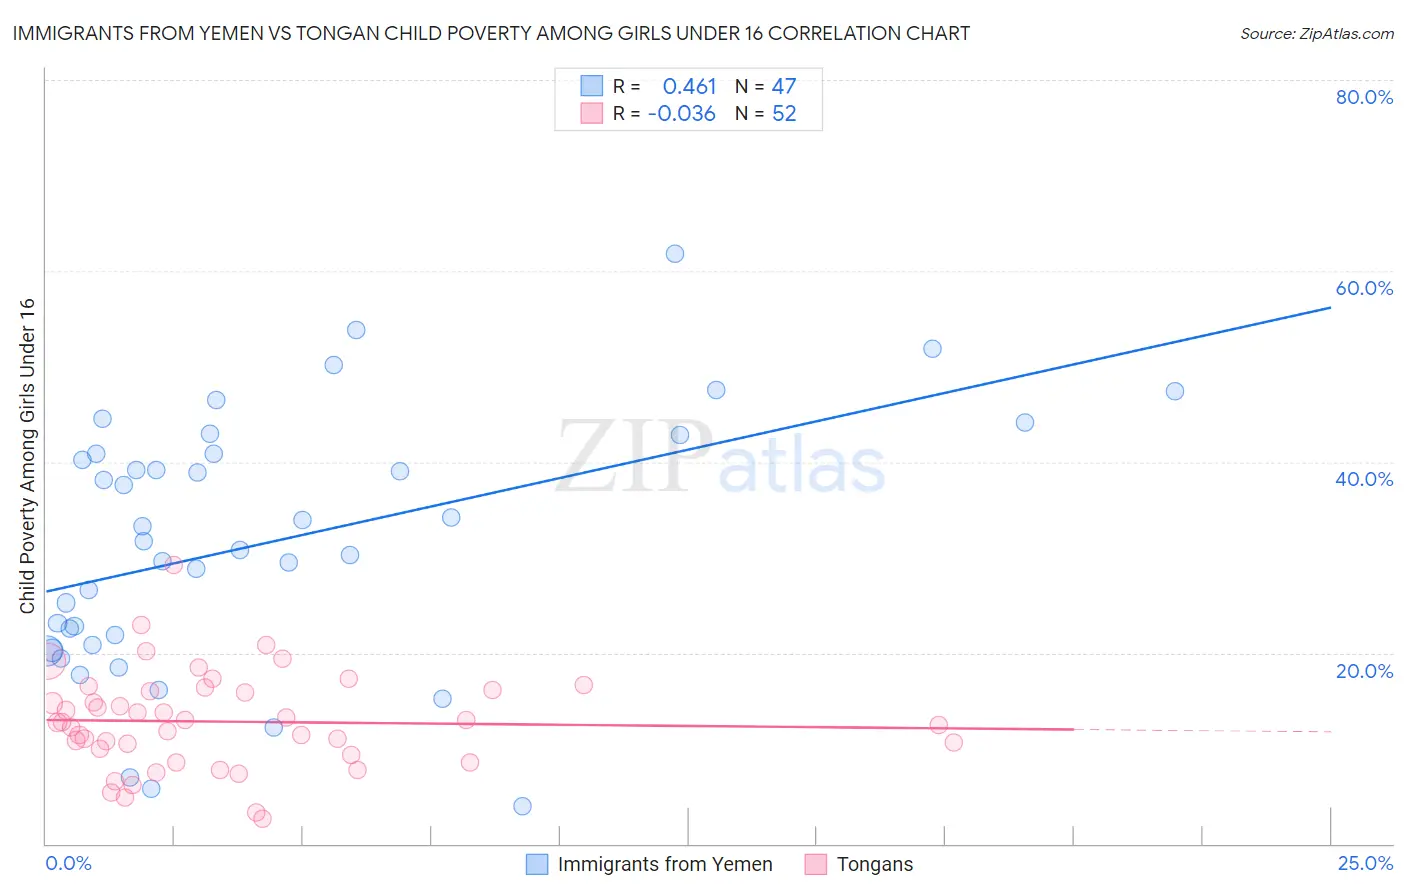
Immigrants from Yemen vs Tongan Child Poverty Among Girls Under 16 Correlation Chart

The statistical analysis conducted on geographies consisting of 82,295,709 people shows a moderate positive correlation between the proportion of Immigrants from Yemen and poverty level among girls under the age of 16 in the United States with a correlation coefficient (R) of 0.461 and weighted average of 29.5%. Similarly, the statistical analysis conducted on geographies consisting of 102,473,172 people shows no correlation between the proportion of Tongans and poverty level among girls under the age of 16 in the United States with a correlation coefficient (R) of -0.036 and weighted average of 13.6%, a difference of 117.4%.
Immigrants from Yemen vs Tongan Child Poverty Among Girls Under 16

Child Poverty Among Girls Under 16 Correlation Summary

MeasurementImmigrants from YemenTongan
Minimum3.9%2.7%
Maximum61.8%29.2%
Range57.9%26.5%
Mean31.7%12.8%
Median31.7%12.7%
Interquartile 25% (IQ1)20.8%9.7%
Interquartile 75% (IQ3)40.8%16.1%
Interquartile Range (IQR)20.0%6.4%
Standard Deviation (Sample)13.4%5.1%
Standard Deviation (Population)13.2%5.0%

Similar Demographics by Child Poverty Among Girls Under 16

Demographics Similar to Immigrants from Yemen by Child Poverty Among Girls Under 16

In terms of child poverty among girls under 16, the demographic groups most similar to Immigrants from Yemen are Navajo (30.5%, a difference of 3.3%), Lumbee (30.7%, a difference of 4.1%), Pima (28.2%, a difference of 4.5%), Hopi (27.9%, a difference of 5.9%), and Tohono O'odham (31.6%, a difference of 7.2%).
DemographicsRating | RankChild Poverty Among Girls Under 16
Blacks/African Americans
0.0
/100
|
#333
Tragic
24.7%
Menominee
0.0
/100
|
#334
Tragic
25.0%
Pueblo
0.0
/100
|
#335
Tragic
25.2%
Sioux
0.0
/100
|
#336
Tragic
25.6%
Yup'ik
0.0
/100
|
#337
Tragic
25.8%
Cheyenne
0.0
/100
|
#338
Tragic
26.3%
Crow
0.0
/100
|
#339
Tragic
26.4%
Yuman
0.0
/100
|
#340
Tragic
27.1%
Hopi
0.0
/100
|
#341
Tragic
27.9%
Pima
0.0
/100
|
#342
Tragic
28.2%
Immigrants | Yemen
0.0
/100
|
#343
Tragic
29.5%
Navajo
0.0
/100
|
#344
Tragic
30.5%
Lumbee
0.0
/100
|
#345
Tragic
30.7%
Tohono O'odham
0.0
/100
|
#346
Tragic
31.6%
Puerto Ricans
0.0
/100
|
#347
Tragic
32.7%

Demographics Similar to Tongans by Child Poverty Among Girls Under 16

In terms of child poverty among girls under 16, the demographic groups most similar to Tongans are Bolivian (13.6%, a difference of 0.12%), Latvian (13.5%, a difference of 0.26%), Eastern European (13.5%, a difference of 0.28%), Asian (13.7%, a difference of 0.79%), and Turkish (13.7%, a difference of 0.91%).
DemographicsRating | RankChild Poverty Among Girls Under 16
Assyrians/Chaldeans/Syriacs
99.9
/100
|
#21
Exceptional
13.3%
Indians (Asian)
99.9
/100
|
#22
Exceptional
13.3%
Norwegians
99.9
/100
|
#23
Exceptional
13.3%
Immigrants | Eastern Asia
99.9
/100
|
#24
Exceptional
13.4%
Immigrants | China
99.8
/100
|
#25
Exceptional
13.4%
Eastern Europeans
99.8
/100
|
#26
Exceptional
13.5%
Latvians
99.8
/100
|
#27
Exceptional
13.5%
Tongans
99.8
/100
|
#28
Exceptional
13.6%
Bolivians
99.8
/100
|
#29
Exceptional
13.6%
Asians
99.7
/100
|
#30
Exceptional
13.7%
Turks
99.7
/100
|
#31
Exceptional
13.7%
Danes
99.7
/100
|
#32
Exceptional
13.7%
Swedes
99.7
/100
|
#33
Exceptional
13.7%
Maltese
99.7
/100
|
#34
Exceptional
13.7%
Immigrants | Northern Europe
99.6
/100
|
#35
Exceptional
13.8%