Immigrants from Western Europe vs Swiss Seniors Poverty Over the Age of 75
COMPARE
Immigrants from Western Europe
Swiss
Seniors Poverty Over the Age of 75
Seniors Poverty Over the Age of 75 Comparison
Immigrants from Western Europe
Swiss
11.9%
SENIORS POVERTY OVER THE AGE OF 75
79.6/ 100
METRIC RATING
131st/ 347
METRIC RANK
10.7%
SENIORS POVERTY OVER THE AGE OF 75
99.7/ 100
METRIC RATING
30th/ 347
METRIC RANK
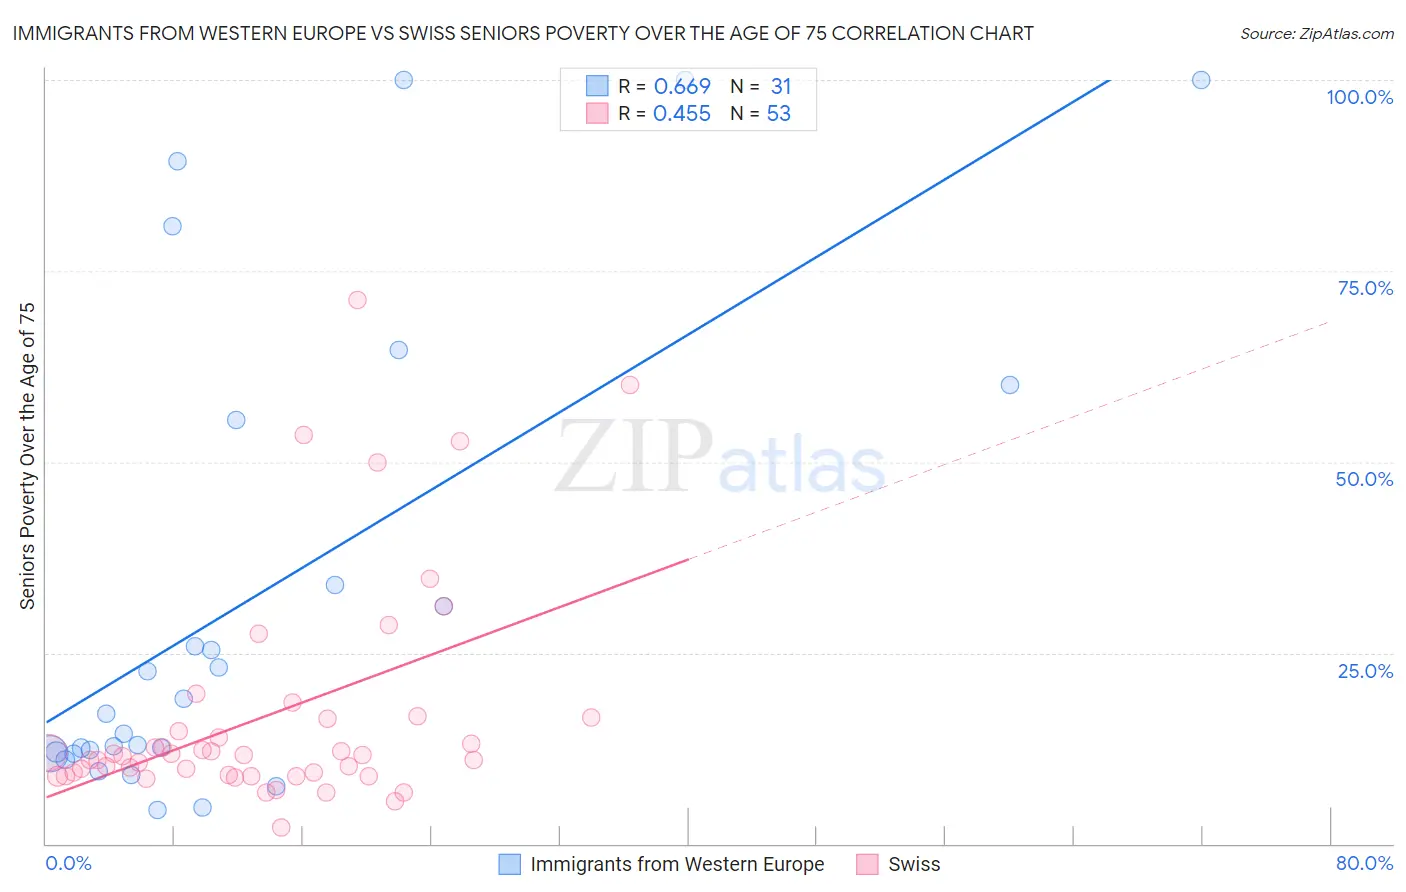
Immigrants from Western Europe vs Swiss Seniors Poverty Over the Age of 75 Correlation Chart
The statistical analysis conducted on geographies consisting of 485,519,113 people shows a significant positive correlation between the proportion of Immigrants from Western Europe and poverty level among seniors over the age of 75 in the United States with a correlation coefficient (R) of 0.669 and weighted average of 11.9%. Similarly, the statistical analysis conducted on geographies consisting of 456,866,168 people shows a moderate positive correlation between the proportion of Swiss and poverty level among seniors over the age of 75 in the United States with a correlation coefficient (R) of 0.455 and weighted average of 10.7%, a difference of 10.6%.
Seniors Poverty Over the Age of 75 Correlation Summary
| Measurement | Immigrants from Western Europe | Swiss |
| Minimum | 4.4% | 2.1% |
| Maximum | 100.0% | 71.2% |
| Range | 95.6% | 69.1% |
| Mean | 32.5% | 16.7% |
| Median | 17.0% | 11.5% |
| Interquartile 25% (IQ1) | 11.8% | 8.9% |
| Interquartile 75% (IQ3) | 55.6% | 16.4% |
| Interquartile Range (IQR) | 43.7% | 7.5% |
| Standard Deviation (Sample) | 31.4% | 14.8% |
| Standard Deviation (Population) | 30.9% | 14.7% |
Similar Demographics by Seniors Poverty Over the Age of 75
Demographics Similar to Immigrants from Western Europe by Seniors Poverty Over the Age of 75
In terms of seniors poverty over the age of 75, the demographic groups most similar to Immigrants from Western Europe are Spanish (11.8%, a difference of 0.12%), Ethiopian (11.8%, a difference of 0.14%), Lebanese (11.9%, a difference of 0.16%), Immigrants from Sierra Leone (11.9%, a difference of 0.25%), and Immigrants from Hungary (11.8%, a difference of 0.28%).
| Demographics | Rating | Rank | Seniors Poverty Over the Age of 75 |
| Fijians | 83.8 /100 | #124 | Excellent 11.8% |
| Sudanese | 83.6 /100 | #125 | Excellent 11.8% |
| Pennsylvania Germans | 83.4 /100 | #126 | Excellent 11.8% |
| Immigrants | Denmark | 82.6 /100 | #127 | Excellent 11.8% |
| Immigrants | Hungary | 81.7 /100 | #128 | Excellent 11.8% |
| Ethiopians | 80.7 /100 | #129 | Excellent 11.8% |
| Spanish | 80.5 /100 | #130 | Excellent 11.8% |
| Immigrants | Western Europe | 79.6 /100 | #131 | Good 11.9% |
| Lebanese | 78.3 /100 | #132 | Good 11.9% |
| Immigrants | Sierra Leone | 77.6 /100 | #133 | Good 11.9% |
| Ugandans | 77.1 /100 | #134 | Good 11.9% |
| Immigrants | Ireland | 76.2 /100 | #135 | Good 11.9% |
| Immigrants | Philippines | 75.0 /100 | #136 | Good 11.9% |
| Immigrants | Moldova | 74.1 /100 | #137 | Good 11.9% |
| Immigrants | Romania | 72.6 /100 | #138 | Good 11.9% |
Demographics Similar to Swiss by Seniors Poverty Over the Age of 75
In terms of seniors poverty over the age of 75, the demographic groups most similar to Swiss are Assyrian/Chaldean/Syriac (10.7%, a difference of 0.080%), Marshallese (10.7%, a difference of 0.19%), Irish (10.7%, a difference of 0.23%), Northern European (10.7%, a difference of 0.29%), and British (10.7%, a difference of 0.32%).
| Demographics | Rating | Rank | Seniors Poverty Over the Age of 75 |
| Lithuanians | 99.8 /100 | #23 | Exceptional 10.6% |
| Poles | 99.8 /100 | #24 | Exceptional 10.6% |
| Menominee | 99.8 /100 | #25 | Exceptional 10.6% |
| Bulgarians | 99.8 /100 | #26 | Exceptional 10.7% |
| Northern Europeans | 99.8 /100 | #27 | Exceptional 10.7% |
| Irish | 99.8 /100 | #28 | Exceptional 10.7% |
| Assyrians/Chaldeans/Syriacs | 99.8 /100 | #29 | Exceptional 10.7% |
| Swiss | 99.7 /100 | #30 | Exceptional 10.7% |
| Marshallese | 99.7 /100 | #31 | Exceptional 10.7% |
| British | 99.7 /100 | #32 | Exceptional 10.7% |
| Puget Sound Salish | 99.7 /100 | #33 | Exceptional 10.8% |
| Italians | 99.7 /100 | #34 | Exceptional 10.8% |
| Luxembourgers | 99.6 /100 | #35 | Exceptional 10.8% |
| Scotch-Irish | 99.6 /100 | #36 | Exceptional 10.8% |
| Latvians | 99.6 /100 | #37 | Exceptional 10.8% |