Immigrants from Western Europe vs Nicaraguan Male Poverty

COMPARE

Immigrants from Western Europe
Race
Ancestry
AfghanAfricanAlaska NativeAlaskan AthabascanAlbanianAleutAlsatianAmericanApacheArabArapahoArgentineanArmenianAssyrian/Chaldean/SyriacAustralianAustrianBahamianBangladeshiBarbadianBasqueBelgianBelizeanBermudanBhutaneseBlackfeetBolivianBrazilianBritishBritish West IndianBulgarianBurmeseCajunCambodianCanadianCape VerdeanCarpatho RusynCelticCentral AmericanCentral American IndianCherokeeCheyenneChickasawChileanChineseChippewaChoctawColombianColvilleComancheCosta RicanCreeCreekCroatianCrowCubanCypriotCzechCzechoslovakianDanishDelawareDominicanDutchDutch West IndianEastern EuropeanEcuadorianEgyptianEnglishEstonianEthiopianEuropeanFijianFilipinoFinnishFrenchFrench American IndianFrench CanadianGermanGerman RussianGhanaianGreekGuamanian/ChamorroGuatemalanGuyaneseHaitianHmongHonduranHopiHoumaHungarianIcelanderIndian (Asian)IndonesianInupiatIranianIraqiIrishIroquoisIsraeliItalianJamaicanJapaneseJordanianKenyanKiowaKoreanLaotianLatvianLebaneseLiberianLithuanianLumbeeLuxembourgerMacedonianMalaysianMalteseMarshalleseMenomineeMexicanMexican American IndianMongolianMoroccanNative HawaiianNavajoNepaleseNew ZealanderNigerianNorthern EuropeanNorwegianOkinawanOsageOttawaPaiutePakistaniPalestinianPanamanianParaguayanPennsylvania GermanPeruvianPimaPolishPortuguesePotawatomiPuebloPuerto RicanPuget Sound SalishRomanianRussianSalvadoranSamoanScandinavianScotch-IrishScottishSeminoleSenegaleseSerbianShoshoneSierra LeoneanSiouxSlavicSlovakSloveneSomaliSouth AfricanSouth AmericanSouth American IndianSoviet UnionSpaniardSpanishSpanish AmericanSpanish American IndianSri LankanSubsaharan AfricanSudaneseSwedishSwissSyrianTaiwaneseThaiTlingit-HaidaTohono O'OdhamTonganTrinidadian and TobagonianTsimshianTurkishU.S. Virgin IslanderUgandanUkrainianUruguayanUteVenezuelanVietnameseWelshWest IndianYakamaYaquiYugoslavianYumanYup'ikZimbabwean
Immigration
NonimmigrantsImmigrantsAfghanistanAfricaAlbaniaArgentinaArmeniaAsiaAustraliaAustriaBahamasBangladeshBarbadosBelarusBelgiumBelizeBoliviaBosnia and HerzegovinaBrazilBulgariaBurma/MyanmarCabo VerdeCambodiaCameroonCanadaCaribbeanCentral AmericaChileChinaColombiaCongoCosta RicaCroatiaCubaCzechoslovakiaDenmarkDominicaDominican RepublicEastern AfricaEastern AsiaEastern EuropeEcuadorEgyptEl SalvadorEnglandEritreaEthiopiaEuropeFijiFranceGermanyGhanaGreeceGrenadaGuatemalaGuyanaHaitiHondurasHong KongHungaryIndiaIndonesiaIranIraqIrelandIsraelItalyJamaicaJapanJordanKazakhstanKenyaKoreaKuwaitLaosLatin AmericaLatviaLebanonLiberiaLithuaniaMalaysiaMexicoMicronesiaMiddle AfricaMoldovaMoroccoNepalNetherlandsNicaraguaNigeriaNorth AmericaNorth MacedoniaNorthern AfricaNorthern EuropeNorwayOceaniaPakistanPanamaPeruPhilippinesPolandPortugalRomaniaRussiaSaudi ArabiaScotlandSenegalSerbiaSierra LeoneSingaporeSomaliaSouth AfricaSouth AmericaSouth Central AsiaSouth Eastern AsiaSouthern EuropeSpainSri LankaSt. Vincent and the GrenadinesSudanSwedenSwitzerlandSyriaTaiwanThailandTrinidad and TobagoTurkeyUgandaUkraineUruguayUzbekistanVenezuelaVietnamWest IndiesWestern AfricaWestern AsiaWestern EuropeYemenZaireZimbabweAzores
Nicaraguan
Race
Ancestry
AfghanAfricanAlaska NativeAlaskan AthabascanAlbanianAleutAlsatianAmericanApacheArabArapahoArgentineanArmenianAssyrian/Chaldean/SyriacAustralianAustrianBahamianBangladeshiBarbadianBasqueBelgianBelizeanBermudanBhutaneseBlackfeetBolivianBrazilianBritishBritish West IndianBulgarianBurmeseCajunCambodianCanadianCape VerdeanCarpatho RusynCelticCentral AmericanCentral American IndianCherokeeCheyenneChickasawChileanChineseChippewaChoctawColombianColvilleComancheCosta RicanCreeCreekCroatianCrowCubanCypriotCzechCzechoslovakianDanishDelawareDominicanDutchDutch West IndianEastern EuropeanEcuadorianEgyptianEnglishEstonianEthiopianEuropeanFijianFilipinoFinnishFrenchFrench American IndianFrench CanadianGermanGerman RussianGhanaianGreekGuamanian/ChamorroGuatemalanGuyaneseHaitianHmongHonduranHopiHoumaHungarianIcelanderIndian (Asian)IndonesianInupiatIranianIraqiIrishIroquoisIsraeliItalianJamaicanJapaneseJordanianKenyanKiowaKoreanLaotianLatvianLebaneseLiberianLithuanianLumbeeLuxembourgerMacedonianMalaysianMalteseMarshalleseMenomineeMexicanMexican American IndianMongolianMoroccanNative HawaiianNavajoNepaleseNew ZealanderNicaraguanNigerianNorthern EuropeanNorwegianOkinawanOsageOttawaPaiutePakistaniPalestinianPanamanianParaguayanPennsylvania GermanPeruvianPimaPolishPortuguesePotawatomiPuebloPuerto RicanPuget Sound SalishRomanianRussianSalvadoranSamoanScandinavianScotch-IrishScottishSeminoleSenegaleseSerbianShoshoneSierra LeoneanSiouxSlavicSlovakSloveneSomaliSouth AfricanSouth AmericanSouth American IndianSoviet UnionSpaniardSpanishSpanish AmericanSpanish American IndianSri LankanSubsaharan AfricanSudaneseSwedishSwissSyrianTaiwaneseThaiTlingit-HaidaTohono O'OdhamTonganTrinidadian and TobagonianTsimshianTurkishU.S. Virgin IslanderUgandanUkrainianUruguayanUteVenezuelanVietnameseWelshWest IndianYakamaYaquiYugoslavianYumanYup'ikZimbabwean
Immigration
NonimmigrantsImmigrantsAfghanistanAfricaAlbaniaArgentinaArmeniaAsiaAustraliaAustriaBahamasBangladeshBarbadosBelarusBelgiumBelizeBoliviaBosnia and HerzegovinaBrazilBulgariaBurma/MyanmarCabo VerdeCambodiaCameroonCanadaCaribbeanCentral AmericaChileChinaColombiaCongoCosta RicaCroatiaCubaCzechoslovakiaDenmarkDominicaDominican RepublicEastern AfricaEastern AsiaEastern EuropeEcuadorEgyptEl SalvadorEnglandEritreaEthiopiaEuropeFijiFranceGermanyGhanaGreeceGrenadaGuatemalaGuyanaHaitiHondurasHong KongHungaryIndiaIndonesiaIranIraqIrelandIsraelItalyJamaicaJapanJordanKazakhstanKenyaKoreaKuwaitLaosLatin AmericaLatviaLebanonLiberiaLithuaniaMalaysiaMexicoMicronesiaMiddle AfricaMoldovaMoroccoNepalNetherlandsNicaraguaNigeriaNorth AmericaNorth MacedoniaNorthern AfricaNorthern EuropeNorwayOceaniaPakistanPanamaPeruPhilippinesPolandPortugalRomaniaRussiaSaudi ArabiaScotlandSenegalSerbiaSierra LeoneSingaporeSomaliaSouth AfricaSouth AmericaSouth Central AsiaSouth Eastern AsiaSouthern EuropeSpainSri LankaSt. Vincent and the GrenadinesSudanSwedenSwitzerlandSyriaTaiwanThailandTrinidad and TobagoTurkeyUgandaUkraineUruguayUzbekistanVenezuelaVietnamWest IndiesWestern AfricaWestern AsiaYemenZaireZimbabweAzores
Male Poverty
Income
Poverty
Unemployment
Labor Participation
Family Structure
Vehicle Availability
Education Level
Disability

Male Poverty Comparison

Immigrants from Western Europe

Nicaraguans

Excellent
Tragic
10.7%
MALE POVERTY
84.2/ 100
METRIC RATING
128th/ 347
METRIC RANK
12.6%
MALE POVERTY
0.6/ 100
METRIC RATING
232nd/ 347
METRIC RANK

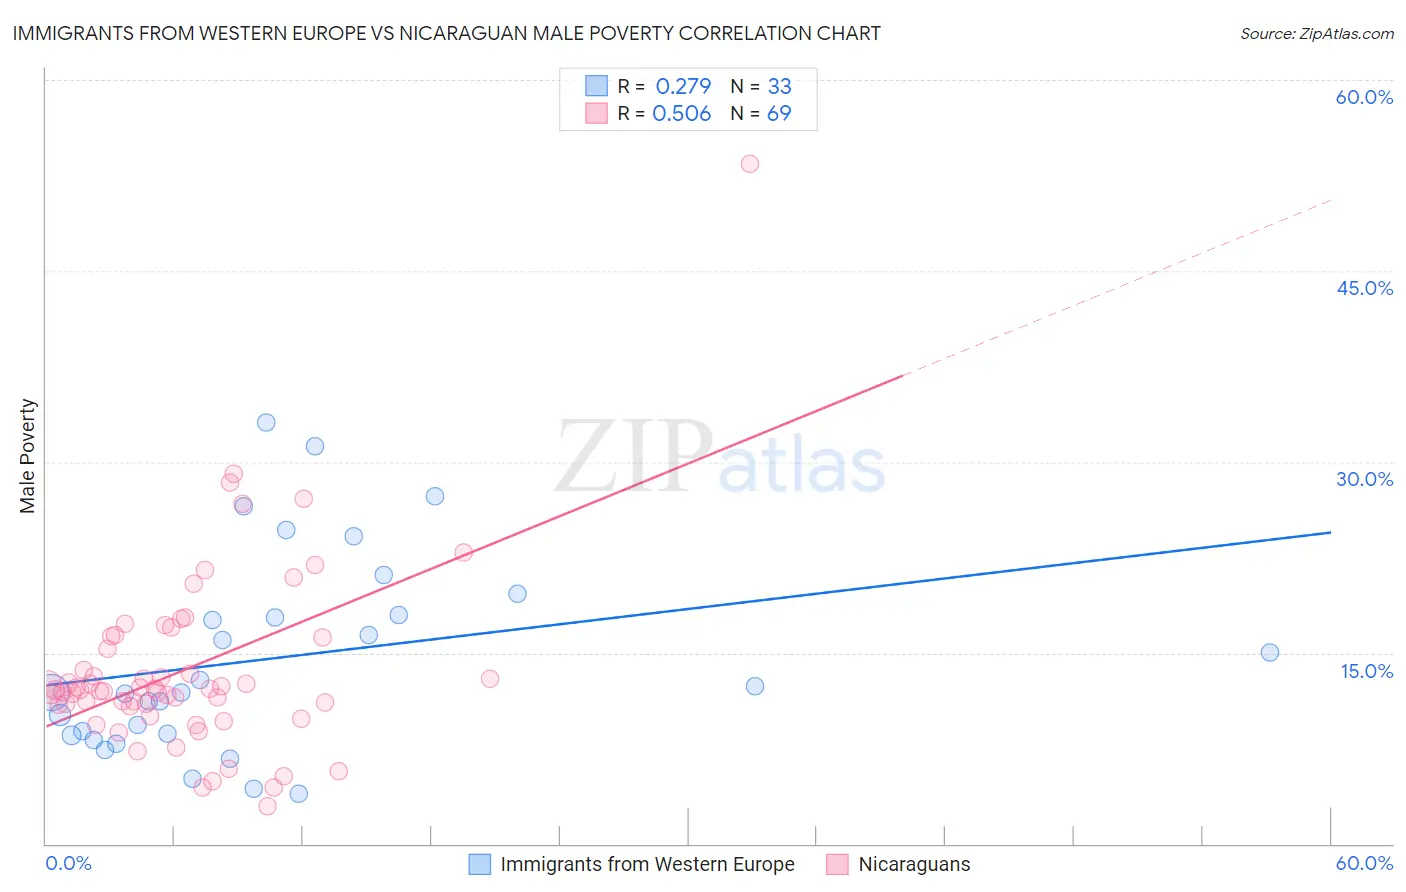
Immigrants from Western Europe vs Nicaraguan Male Poverty Correlation Chart

The statistical analysis conducted on geographies consisting of 493,468,603 people shows a weak positive correlation between the proportion of Immigrants from Western Europe and poverty level among males in the United States with a correlation coefficient (R) of 0.279 and weighted average of 10.7%. Similarly, the statistical analysis conducted on geographies consisting of 285,585,810 people shows a substantial positive correlation between the proportion of Nicaraguans and poverty level among males in the United States with a correlation coefficient (R) of 0.506 and weighted average of 12.6%, a difference of 17.3%.
Immigrants from Western Europe vs Nicaraguan Male Poverty

Male Poverty Correlation Summary

MeasurementImmigrants from Western EuropeNicaraguan
Minimum3.9%2.9%
Maximum33.1%53.4%
Range29.2%50.5%
Mean14.6%13.7%
Median11.9%12.1%
Interquartile 25% (IQ1)8.6%10.9%
Interquartile 75% (IQ3)18.8%16.3%
Interquartile Range (IQR)10.2%5.4%
Standard Deviation (Sample)7.8%7.3%
Standard Deviation (Population)7.7%7.3%

Similar Demographics by Male Poverty

Demographics Similar to Immigrants from Western Europe by Male Poverty

In terms of male poverty, the demographic groups most similar to Immigrants from Western Europe are Immigrants from Peru (10.7%, a difference of 0.010%), Immigrants from Ukraine (10.7%, a difference of 0.020%), Puget Sound Salish (10.7%, a difference of 0.020%), Chilean (10.7%, a difference of 0.060%), and Immigrants from Belarus (10.7%, a difference of 0.17%).
DemographicsRating | RankMale Poverty
Peruvians
87.1
/100
|
#121
Excellent
10.7%
Native Hawaiians
87.0
/100
|
#122
Excellent
10.7%
South Africans
86.8
/100
|
#123
Excellent
10.7%
French
86.7
/100
|
#124
Excellent
10.7%
Immigrants | Norway
86.0
/100
|
#125
Excellent
10.7%
Immigrants | Ukraine
84.3
/100
|
#126
Excellent
10.7%
Puget Sound Salish
84.3
/100
|
#127
Excellent
10.7%
Immigrants | Western Europe
84.2
/100
|
#128
Excellent
10.7%
Immigrants | Peru
84.1
/100
|
#129
Excellent
10.7%
Chileans
83.9
/100
|
#130
Excellent
10.7%
Immigrants | Belarus
83.3
/100
|
#131
Excellent
10.7%
Immigrants | Vietnam
83.0
/100
|
#132
Excellent
10.8%
Pakistanis
83.0
/100
|
#133
Excellent
10.8%
New Zealanders
82.9
/100
|
#134
Excellent
10.8%
Brazilians
82.7
/100
|
#135
Excellent
10.8%

Demographics Similar to Nicaraguans by Male Poverty

In terms of male poverty, the demographic groups most similar to Nicaraguans are Fijian (12.6%, a difference of 0.050%), Immigrants from Armenia (12.6%, a difference of 0.11%), Salvadoran (12.6%, a difference of 0.12%), Immigrants from Laos (12.6%, a difference of 0.47%), and Marshallese (12.5%, a difference of 0.68%).
DemographicsRating | RankMale Poverty
Osage
1.5
/100
|
#225
Tragic
12.3%
Nigerians
1.4
/100
|
#226
Tragic
12.3%
Alaska Natives
1.4
/100
|
#227
Tragic
12.4%
Alsatians
1.3
/100
|
#228
Tragic
12.4%
Cubans
1.3
/100
|
#229
Tragic
12.4%
Marshallese
0.8
/100
|
#230
Tragic
12.5%
Salvadorans
0.6
/100
|
#231
Tragic
12.6%
Nicaraguans
0.6
/100
|
#232
Tragic
12.6%
Fijians
0.6
/100
|
#233
Tragic
12.6%
Immigrants | Armenia
0.6
/100
|
#234
Tragic
12.6%
Immigrants | Laos
0.5
/100
|
#235
Tragic
12.6%
Immigrants | Saudi Arabia
0.4
/100
|
#236
Tragic
12.7%
French American Indians
0.4
/100
|
#237
Tragic
12.7%
Ecuadorians
0.4
/100
|
#238
Tragic
12.7%
Ghanaians
0.4
/100
|
#239
Tragic
12.7%