Immigrants from Western Asia vs Immigrants from Bulgaria Child Poverty Among Girls Under 16

COMPARE

Immigrants from Western Asia
Race
Ancestry
AfghanAfricanAlaska NativeAlaskan AthabascanAlbanianAleutAlsatianAmericanApacheArabArapahoArgentineanArmenianAssyrian/Chaldean/SyriacAustralianAustrianBahamianBangladeshiBarbadianBasqueBelgianBelizeanBermudanBhutaneseBlackfeetBolivianBrazilianBritishBritish West IndianBulgarianBurmeseCajunCambodianCanadianCape VerdeanCarpatho RusynCelticCentral AmericanCentral American IndianCherokeeCheyenneChickasawChileanChineseChippewaChoctawColombianColvilleComancheCosta RicanCreeCreekCroatianCrowCubanCypriotCzechCzechoslovakianDanishDelawareDominicanDutchDutch West IndianEastern EuropeanEcuadorianEgyptianEnglishEstonianEthiopianEuropeanFijianFilipinoFinnishFrenchFrench American IndianFrench CanadianGermanGerman RussianGhanaianGreekGuamanian/ChamorroGuatemalanGuyaneseHaitianHmongHonduranHopiHoumaHungarianIcelanderIndian (Asian)IndonesianInupiatIranianIraqiIrishIroquoisIsraeliItalianJamaicanJapaneseJordanianKenyanKiowaKoreanLaotianLatvianLebaneseLiberianLithuanianLumbeeLuxembourgerMacedonianMalaysianMalteseMarshalleseMenomineeMexicanMexican American IndianMongolianMoroccanNative HawaiianNavajoNepaleseNew ZealanderNicaraguanNigerianNorthern EuropeanNorwegianOkinawanOsageOttawaPaiutePakistaniPalestinianPanamanianParaguayanPennsylvania GermanPeruvianPimaPolishPortuguesePotawatomiPuebloPuerto RicanPuget Sound SalishRomanianRussianSalvadoranSamoanScandinavianScotch-IrishScottishSeminoleSenegaleseSerbianShoshoneSierra LeoneanSiouxSlavicSlovakSloveneSomaliSouth AfricanSouth AmericanSouth American IndianSoviet UnionSpaniardSpanishSpanish AmericanSpanish American IndianSri LankanSubsaharan AfricanSudaneseSwedishSwissSyrianTaiwaneseThaiTlingit-HaidaTohono O'OdhamTonganTrinidadian and TobagonianTsimshianTurkishU.S. Virgin IslanderUgandanUkrainianUruguayanUteVenezuelanVietnameseWelshWest IndianYakamaYaquiYugoslavianYumanYup'ikZimbabwean
Immigration
NonimmigrantsImmigrantsAfghanistanAfricaAlbaniaArgentinaArmeniaAsiaAustraliaAustriaBahamasBangladeshBarbadosBelarusBelgiumBelizeBoliviaBosnia and HerzegovinaBrazilBurma/MyanmarCabo VerdeCambodiaCameroonCanadaCaribbeanCentral AmericaChileChinaColombiaCongoCosta RicaCroatiaCubaCzechoslovakiaDenmarkDominicaDominican RepublicEastern AfricaEastern AsiaEastern EuropeEcuadorEgyptEl SalvadorEnglandEritreaEthiopiaEuropeFijiFranceGermanyGhanaGreeceGrenadaGuatemalaGuyanaHaitiHondurasHong KongHungaryIndiaIndonesiaIranIraqIrelandIsraelItalyJamaicaJapanJordanKazakhstanKenyaKoreaKuwaitLaosLatin AmericaLatviaLebanonLiberiaLithuaniaMalaysiaMexicoMicronesiaMiddle AfricaMoldovaMoroccoNepalNetherlandsNicaraguaNigeriaNorth AmericaNorth MacedoniaNorthern AfricaNorthern EuropeNorwayOceaniaPakistanPanamaPeruPhilippinesPolandPortugalRomaniaRussiaSaudi ArabiaScotlandSenegalSerbiaSierra LeoneSingaporeSomaliaSouth AfricaSouth AmericaSouth Central AsiaSouth Eastern AsiaSouthern EuropeSpainSri LankaSt. Vincent and the GrenadinesSudanSwedenSwitzerlandSyriaTaiwanThailandTrinidad and TobagoTurkeyUgandaUkraineUruguayUzbekistanVenezuelaVietnamWest IndiesWestern AfricaWestern AsiaWestern EuropeYemenZaireZimbabweAzores
Immigrants from Bulgaria
Race
Ancestry
AfghanAfricanAlaska NativeAlaskan AthabascanAlbanianAleutAlsatianAmericanApacheArabArapahoArgentineanArmenianAssyrian/Chaldean/SyriacAustralianAustrianBahamianBangladeshiBarbadianBasqueBelgianBelizeanBermudanBhutaneseBlackfeetBolivianBrazilianBritishBritish West IndianBulgarianBurmeseCajunCambodianCanadianCape VerdeanCarpatho RusynCelticCentral AmericanCentral American IndianCherokeeCheyenneChickasawChileanChineseChippewaChoctawColombianColvilleComancheCosta RicanCreeCreekCroatianCrowCubanCypriotCzechCzechoslovakianDanishDelawareDominicanDutchDutch West IndianEastern EuropeanEcuadorianEgyptianEnglishEstonianEthiopianEuropeanFijianFilipinoFinnishFrenchFrench American IndianFrench CanadianGermanGerman RussianGhanaianGreekGuamanian/ChamorroGuatemalanGuyaneseHaitianHmongHonduranHopiHoumaHungarianIcelanderIndian (Asian)IndonesianInupiatIranianIraqiIrishIroquoisIsraeliItalianJamaicanJapaneseJordanianKenyanKiowaKoreanLaotianLatvianLebaneseLiberianLithuanianLumbeeLuxembourgerMacedonianMalaysianMalteseMarshalleseMenomineeMexicanMexican American IndianMongolianMoroccanNative HawaiianNavajoNepaleseNew ZealanderNicaraguanNigerianNorthern EuropeanNorwegianOkinawanOsageOttawaPaiutePakistaniPalestinianPanamanianParaguayanPennsylvania GermanPeruvianPimaPolishPortuguesePotawatomiPuebloPuerto RicanPuget Sound SalishRomanianRussianSalvadoranSamoanScandinavianScotch-IrishScottishSeminoleSenegaleseSerbianShoshoneSierra LeoneanSiouxSlavicSlovakSloveneSomaliSouth AfricanSouth AmericanSouth American IndianSoviet UnionSpaniardSpanishSpanish AmericanSpanish American IndianSri LankanSubsaharan AfricanSudaneseSwedishSwissSyrianTaiwaneseThaiTlingit-HaidaTohono O'OdhamTonganTrinidadian and TobagonianTsimshianTurkishU.S. Virgin IslanderUgandanUkrainianUruguayanUteVenezuelanVietnameseWelshWest IndianYakamaYaquiYugoslavianYumanYup'ikZimbabwean
Immigration
NonimmigrantsImmigrantsAfghanistanAfricaAlbaniaArgentinaArmeniaAsiaAustraliaAustriaBahamasBangladeshBarbadosBelarusBelgiumBelizeBoliviaBosnia and HerzegovinaBrazilBulgariaBurma/MyanmarCabo VerdeCambodiaCameroonCanadaCaribbeanCentral AmericaChileChinaColombiaCongoCosta RicaCroatiaCubaCzechoslovakiaDenmarkDominicaDominican RepublicEastern AfricaEastern AsiaEastern EuropeEcuadorEgyptEl SalvadorEnglandEritreaEthiopiaEuropeFijiFranceGermanyGhanaGreeceGrenadaGuatemalaGuyanaHaitiHondurasHong KongHungaryIndiaIndonesiaIranIraqIrelandIsraelItalyJamaicaJapanJordanKazakhstanKenyaKoreaKuwaitLaosLatin AmericaLatviaLebanonLiberiaLithuaniaMalaysiaMexicoMicronesiaMiddle AfricaMoldovaMoroccoNepalNetherlandsNicaraguaNigeriaNorth AmericaNorth MacedoniaNorthern AfricaNorthern EuropeNorwayOceaniaPakistanPanamaPeruPhilippinesPolandPortugalRomaniaRussiaSaudi ArabiaScotlandSenegalSerbiaSierra LeoneSingaporeSomaliaSouth AfricaSouth AmericaSouth Central AsiaSouth Eastern AsiaSouthern EuropeSpainSri LankaSt. Vincent and the GrenadinesSudanSwedenSwitzerlandSyriaTaiwanThailandTrinidad and TobagoTurkeyUgandaUkraineUruguayUzbekistanVenezuelaVietnamWest IndiesWestern AfricaWestern EuropeYemenZaireZimbabweAzores
Child Poverty Among Girls Under 16
Income
Poverty
Unemployment
Labor Participation
Family Structure
Vehicle Availability
Education Level
Disability

Child Poverty Among Girls Under 16 Comparison

Immigrants from Western Asia

Immigrants from Bulgaria

Average
Exceptional
16.6%
CHILD POVERTY AMONG GIRLS UNDER 16
44.1/ 100
METRIC RATING
177th/ 347
METRIC RANK
14.4%
CHILD POVERTY AMONG GIRLS UNDER 16
98.8/ 100
METRIC RATING
58th/ 347
METRIC RANK

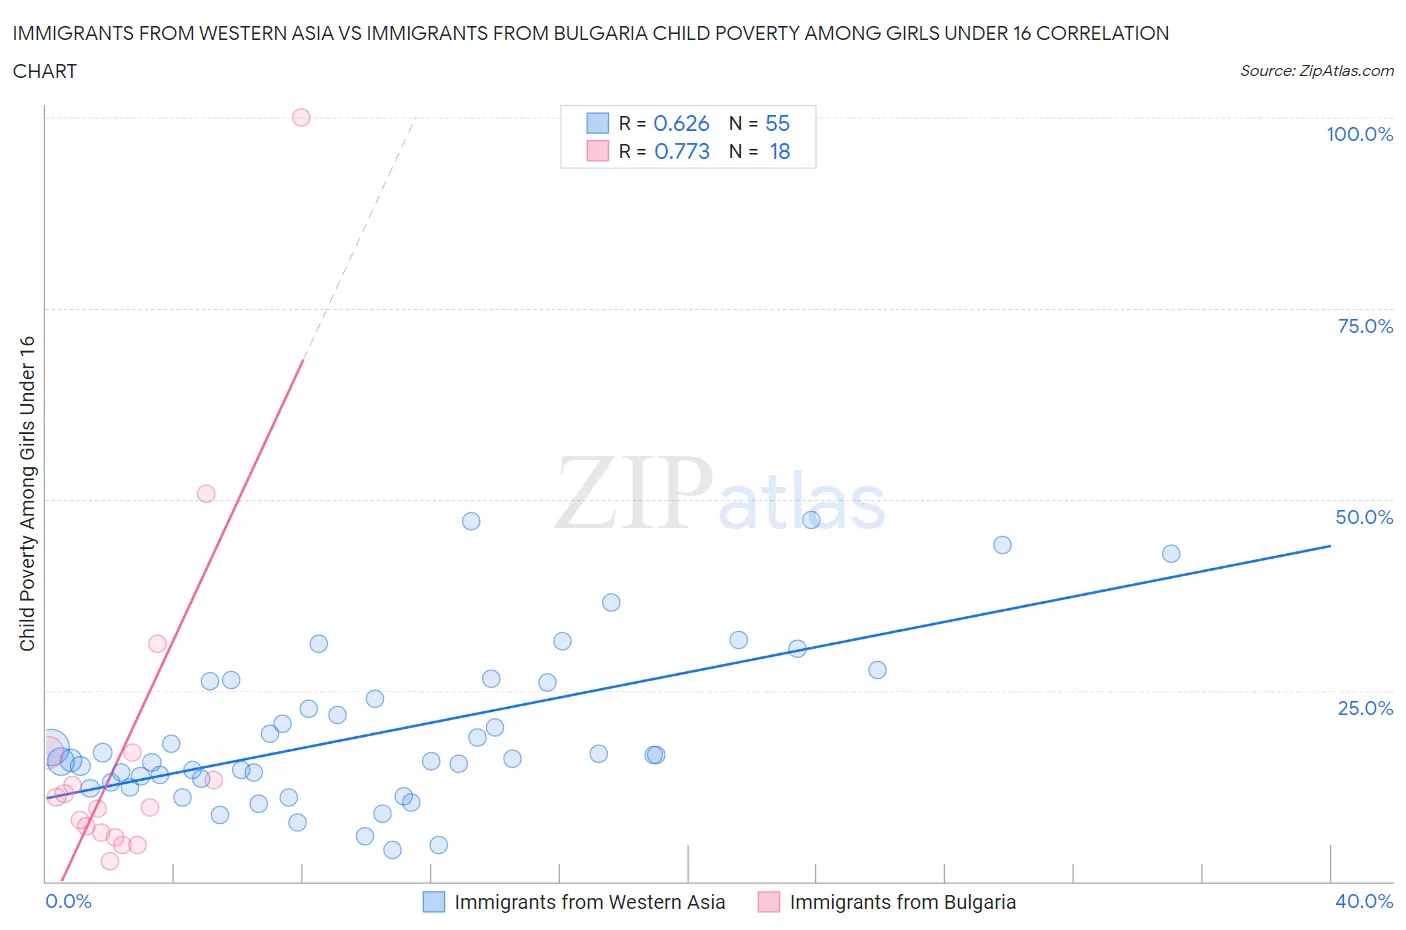
Immigrants from Western Asia vs Immigrants from Bulgaria Child Poverty Among Girls Under 16 Correlation Chart

The statistical analysis conducted on geographies consisting of 396,058,338 people shows a significant positive correlation between the proportion of Immigrants from Western Asia and poverty level among girls under the age of 16 in the United States with a correlation coefficient (R) of 0.626 and weighted average of 16.6%. Similarly, the statistical analysis conducted on geographies consisting of 170,743,744 people shows a strong positive correlation between the proportion of Immigrants from Bulgaria and poverty level among girls under the age of 16 in the United States with a correlation coefficient (R) of 0.773 and weighted average of 14.4%, a difference of 15.4%.
Immigrants from Western Asia vs Immigrants from Bulgaria Child Poverty Among Girls Under 16

Child Poverty Among Girls Under 16 Correlation Summary

MeasurementImmigrants from Western AsiaImmigrants from Bulgaria
Minimum4.1%2.6%
Maximum47.4%100.0%
Range43.3%97.4%
Mean19.3%17.9%
Median16.1%10.4%
Interquartile 25% (IQ1)12.9%6.3%
Interquartile 75% (IQ3)26.1%16.8%
Interquartile Range (IQR)13.1%10.5%
Standard Deviation (Sample)10.3%23.4%
Standard Deviation (Population)10.2%22.8%

Similar Demographics by Child Poverty Among Girls Under 16

Demographics Similar to Immigrants from Western Asia by Child Poverty Among Girls Under 16

In terms of child poverty among girls under 16, the demographic groups most similar to Immigrants from Western Asia are White/Caucasian (16.6%, a difference of 0.060%), Hawaiian (16.6%, a difference of 0.080%), Immigrants from Syria (16.6%, a difference of 0.090%), Hungarian (16.6%, a difference of 0.11%), and Immigrants from Iraq (16.6%, a difference of 0.11%).
DemographicsRating | RankChild Poverty Among Girls Under 16
Immigrants | Venezuela
64.2
/100
|
#170
Good
16.2%
Immigrants | Saudi Arabia
64.0
/100
|
#171
Good
16.2%
Afghans
62.3
/100
|
#172
Good
16.2%
Immigrants | South America
55.1
/100
|
#173
Average
16.4%
Ethiopians
50.0
/100
|
#174
Average
16.5%
Lebanese
45.4
/100
|
#175
Average
16.6%
Hungarians
45.1
/100
|
#176
Average
16.6%
Immigrants | Western Asia
44.1
/100
|
#177
Average
16.6%
Whites/Caucasians
43.6
/100
|
#178
Average
16.6%
Hawaiians
43.4
/100
|
#179
Average
16.6%
Immigrants | Syria
43.3
/100
|
#180
Average
16.6%
Immigrants | Iraq
43.2
/100
|
#181
Average
16.6%
Immigrants | Ethiopia
43.1
/100
|
#182
Average
16.6%
Immigrants | Portugal
42.5
/100
|
#183
Average
16.6%
Scotch-Irish
39.6
/100
|
#184
Fair
16.7%

Demographics Similar to Immigrants from Bulgaria by Child Poverty Among Girls Under 16

In terms of child poverty among girls under 16, the demographic groups most similar to Immigrants from Bulgaria are Zimbabwean (14.4%, a difference of 0.060%), Immigrants from Serbia (14.4%, a difference of 0.090%), Immigrants from Indonesia (14.4%, a difference of 0.13%), Immigrants from Romania (14.3%, a difference of 0.21%), and Estonian (14.3%, a difference of 0.25%).
DemographicsRating | RankChild Poverty Among Girls Under 16
Immigrants | Pakistan
99.1
/100
|
#51
Exceptional
14.2%
Italians
99.1
/100
|
#52
Exceptional
14.3%
Luxembourgers
99.0
/100
|
#53
Exceptional
14.3%
Estonians
98.9
/100
|
#54
Exceptional
14.3%
Immigrants | Romania
98.9
/100
|
#55
Exceptional
14.3%
Immigrants | Indonesia
98.9
/100
|
#56
Exceptional
14.4%
Immigrants | Serbia
98.9
/100
|
#57
Exceptional
14.4%
Immigrants | Bulgaria
98.8
/100
|
#58
Exceptional
14.4%
Zimbabweans
98.8
/100
|
#59
Exceptional
14.4%
Poles
98.7
/100
|
#60
Exceptional
14.4%
Cambodians
98.7
/100
|
#61
Exceptional
14.4%
Scandinavians
98.7
/100
|
#62
Exceptional
14.4%
Immigrants | Europe
98.7
/100
|
#63
Exceptional
14.4%
Immigrants | Philippines
98.6
/100
|
#64
Exceptional
14.4%
Immigrants | Sweden
98.6
/100
|
#65
Exceptional
14.5%