Immigrants from West Indies vs Potawatomi Poverty
COMPARE
Immigrants from West Indies
Potawatomi
Poverty
Poverty Comparison
Immigrants from West Indies
Potawatomi
14.8%
POVERTY
0.0/ 100
METRIC RATING
275th/ 347
METRIC RANK
14.1%
POVERTY
0.3/ 100
METRIC RATING
246th/ 347
METRIC RANK
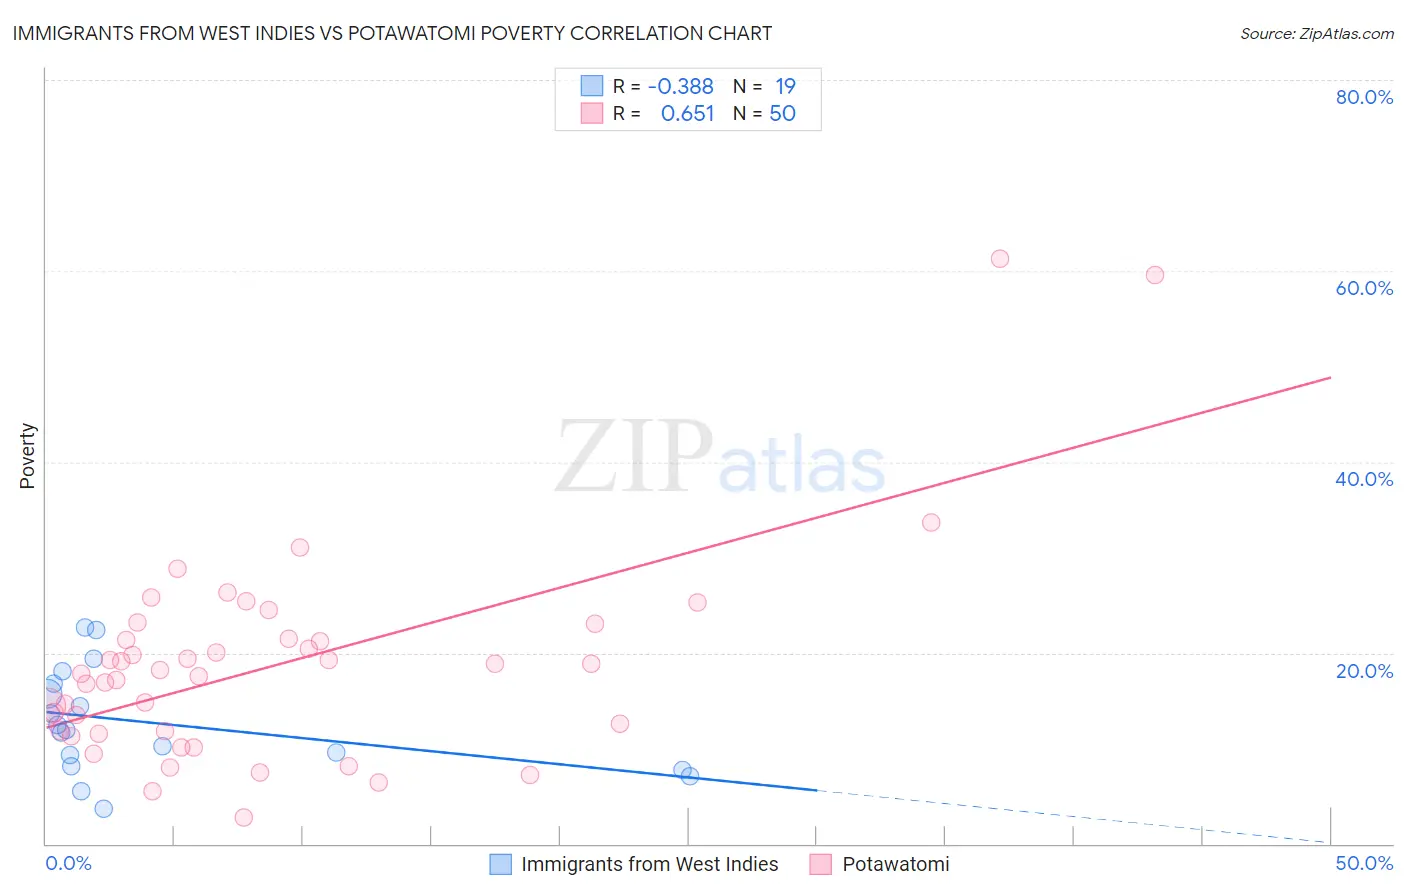
Immigrants from West Indies vs Potawatomi Poverty Correlation Chart
The statistical analysis conducted on geographies consisting of 72,454,628 people shows a mild negative correlation between the proportion of Immigrants from West Indies and poverty level in the United States with a correlation coefficient (R) of -0.388 and weighted average of 14.8%. Similarly, the statistical analysis conducted on geographies consisting of 117,756,433 people shows a significant positive correlation between the proportion of Potawatomi and poverty level in the United States with a correlation coefficient (R) of 0.651 and weighted average of 14.1%, a difference of 5.0%.
Poverty Correlation Summary
| Measurement | Immigrants from West Indies | Potawatomi |
| Minimum | 3.7% | 2.7% |
| Maximum | 22.6% | 61.3% |
| Range | 18.9% | 58.6% |
| Mean | 12.6% | 18.7% |
| Median | 11.9% | 18.0% |
| Interquartile 25% (IQ1) | 8.2% | 11.8% |
| Interquartile 75% (IQ3) | 16.8% | 21.5% |
| Interquartile Range (IQR) | 8.6% | 9.7% |
| Standard Deviation (Sample) | 5.4% | 11.0% |
| Standard Deviation (Population) | 5.3% | 10.9% |
Similar Demographics by Poverty
Demographics Similar to Immigrants from West Indies by Poverty
In terms of poverty, the demographic groups most similar to Immigrants from West Indies are Immigrants from Bahamas (14.8%, a difference of 0.0%), Barbadian (14.8%, a difference of 0.040%), Bangladeshi (14.8%, a difference of 0.060%), Belizean (14.8%, a difference of 0.080%), and Immigrants from St. Vincent and the Grenadines (14.9%, a difference of 0.37%).
| Demographics | Rating | Rank | Poverty |
| Sub-Saharan Africans | 0.1 /100 | #268 | Tragic 14.5% |
| Immigrants | Cuba | 0.1 /100 | #269 | Tragic 14.6% |
| Central Americans | 0.1 /100 | #270 | Tragic 14.6% |
| Shoshone | 0.0 /100 | #271 | Tragic 14.7% |
| Chickasaw | 0.0 /100 | #272 | Tragic 14.7% |
| Spanish Americans | 0.0 /100 | #273 | Tragic 14.7% |
| Barbadians | 0.0 /100 | #274 | Tragic 14.8% |
| Immigrants | West Indies | 0.0 /100 | #275 | Tragic 14.8% |
| Immigrants | Bahamas | 0.0 /100 | #276 | Tragic 14.8% |
| Bangladeshis | 0.0 /100 | #277 | Tragic 14.8% |
| Belizeans | 0.0 /100 | #278 | Tragic 14.8% |
| Immigrants | St. Vincent and the Grenadines | 0.0 /100 | #279 | Tragic 14.9% |
| Haitians | 0.0 /100 | #280 | Tragic 14.9% |
| Immigrants | Barbados | 0.0 /100 | #281 | Tragic 14.9% |
| Comanche | 0.0 /100 | #282 | Tragic 15.0% |
Demographics Similar to Potawatomi by Poverty
In terms of poverty, the demographic groups most similar to Potawatomi are Immigrants from Sudan (14.1%, a difference of 0.20%), Liberian (14.1%, a difference of 0.28%), Immigrants from Western Africa (14.1%, a difference of 0.30%), Immigrants from Ghana (14.2%, a difference of 0.40%), and Nepalese (14.0%, a difference of 0.59%).
| Demographics | Rating | Rank | Poverty |
| Nicaraguans | 0.4 /100 | #239 | Tragic 13.9% |
| Immigrants | Middle Africa | 0.4 /100 | #240 | Tragic 14.0% |
| Salvadorans | 0.4 /100 | #241 | Tragic 14.0% |
| Ecuadorians | 0.4 /100 | #242 | Tragic 14.0% |
| Sudanese | 0.3 /100 | #243 | Tragic 14.0% |
| Nepalese | 0.3 /100 | #244 | Tragic 14.0% |
| Immigrants | Sudan | 0.3 /100 | #245 | Tragic 14.1% |
| Potawatomi | 0.3 /100 | #246 | Tragic 14.1% |
| Liberians | 0.2 /100 | #247 | Tragic 14.1% |
| Immigrants | Western Africa | 0.2 /100 | #248 | Tragic 14.1% |
| Immigrants | Ghana | 0.2 /100 | #249 | Tragic 14.2% |
| Cree | 0.2 /100 | #250 | Tragic 14.2% |
| Immigrants | Burma/Myanmar | 0.2 /100 | #251 | Tragic 14.2% |
| Spanish American Indians | 0.2 /100 | #252 | Tragic 14.2% |
| Immigrants | Trinidad and Tobago | 0.2 /100 | #253 | Tragic 14.2% |