Immigrants from West Indies vs Assyrian/Chaldean/Syriac Female Poverty Among 25-34 Year Olds

COMPARE

Immigrants from West Indies
Race
Ancestry
AfghanAfricanAlaska NativeAlaskan AthabascanAlbanianAleutAlsatianAmericanApacheArabArapahoArgentineanArmenianAustralianAustrianBahamianBangladeshiBarbadianBasqueBelgianBelizeanBermudanBhutaneseBlackfeetBolivianBrazilianBritishBritish West IndianBulgarianBurmeseCajunCambodianCanadianCape VerdeanCarpatho RusynCelticCentral AmericanCentral American IndianCherokeeCheyenneChickasawChileanChineseChippewaChoctawColombianColvilleComancheCosta RicanCreeCreekCroatianCrowCubanCypriotCzechCzechoslovakianDanishDelawareDominicanDutchDutch West IndianEastern EuropeanEcuadorianEgyptianEnglishEstonianEthiopianEuropeanFijianFilipinoFinnishFrenchFrench American IndianFrench CanadianGermanGerman RussianGhanaianGreekGuamanian/ChamorroGuatemalanGuyaneseHaitianHmongHonduranHopiHoumaHungarianIcelanderIndian (Asian)IndonesianInupiatIranianIraqiIrishIroquoisIsraeliItalianJamaicanJapaneseJordanianKenyanKiowaKoreanLaotianLatvianLebaneseLiberianLithuanianLumbeeLuxembourgerMacedonianMalaysianMalteseMarshalleseMenomineeMexicanMexican American IndianMongolianMoroccanNative HawaiianNavajoNepaleseNew ZealanderNicaraguanNigerianNorthern EuropeanNorwegianOkinawanOsageOttawaPaiutePakistaniPalestinianPanamanianParaguayanPennsylvania GermanPeruvianPimaPolishPortuguesePotawatomiPuebloPuerto RicanPuget Sound SalishRomanianRussianSalvadoranSamoanScandinavianScotch-IrishScottishSeminoleSenegaleseSerbianShoshoneSierra LeoneanSiouxSlavicSlovakSloveneSomaliSouth AfricanSouth AmericanSouth American IndianSoviet UnionSpaniardSpanishSpanish AmericanSpanish American IndianSri LankanSubsaharan AfricanSudaneseSwedishSwissSyrianTaiwaneseThaiTlingit-HaidaTohono O'OdhamTonganTrinidadian and TobagonianTsimshianTurkishU.S. Virgin IslanderUgandanUkrainianUruguayanUteVenezuelanVietnameseWelshWest IndianYakamaYaquiYugoslavianYumanYup'ikZimbabwean
Immigration
NonimmigrantsImmigrantsAfghanistanAfricaAlbaniaArgentinaArmeniaAsiaAustraliaAustriaBahamasBangladeshBarbadosBelarusBelgiumBelizeBoliviaBosnia and HerzegovinaBrazilBulgariaBurma/MyanmarCabo VerdeCambodiaCameroonCanadaCaribbeanCentral AmericaChileChinaColombiaCongoCosta RicaCroatiaCubaCzechoslovakiaDenmarkDominicaDominican RepublicEastern AfricaEastern AsiaEastern EuropeEcuadorEgyptEl SalvadorEnglandEritreaEthiopiaEuropeFijiFranceGermanyGhanaGreeceGrenadaGuatemalaGuyanaHaitiHondurasHong KongHungaryIndiaIndonesiaIranIraqIrelandIsraelItalyJamaicaJapanJordanKazakhstanKenyaKoreaKuwaitLaosLatin AmericaLatviaLebanonLiberiaLithuaniaMalaysiaMexicoMicronesiaMiddle AfricaMoldovaMoroccoNepalNetherlandsNicaraguaNigeriaNorth AmericaNorth MacedoniaNorthern AfricaNorthern EuropeNorwayOceaniaPakistanPanamaPeruPhilippinesPolandPortugalRomaniaRussiaSaudi ArabiaScotlandSenegalSerbiaSierra LeoneSingaporeSomaliaSouth AfricaSouth AmericaSouth Central AsiaSouth Eastern AsiaSouthern EuropeSpainSri LankaSt. Vincent and the GrenadinesSudanSwedenSwitzerlandSyriaTaiwanThailandTrinidad and TobagoTurkeyUgandaUkraineUruguayUzbekistanVenezuelaVietnamWest IndiesWestern AfricaWestern AsiaWestern EuropeYemenZaireZimbabweAzores
Assyrian/Chaldean/Syriac
Race
Ancestry
AfghanAfricanAlaska NativeAlaskan AthabascanAlbanianAleutAlsatianAmericanApacheArabArapahoArgentineanArmenianAssyrian/Chaldean/SyriacAustralianAustrianBahamianBangladeshiBarbadianBasqueBelgianBelizeanBermudanBhutaneseBlackfeetBolivianBrazilianBritishBritish West IndianBulgarianBurmeseCajunCambodianCanadianCape VerdeanCarpatho RusynCelticCentral AmericanCentral American IndianCherokeeCheyenneChickasawChileanChineseChippewaChoctawColombianColvilleComancheCosta RicanCreeCreekCroatianCrowCubanCypriotCzechCzechoslovakianDanishDelawareDominicanDutchDutch West IndianEastern EuropeanEcuadorianEgyptianEnglishEstonianEthiopianEuropeanFijianFilipinoFinnishFrenchFrench American IndianFrench CanadianGermanGerman RussianGhanaianGreekGuamanian/ChamorroGuatemalanGuyaneseHaitianHmongHonduranHopiHoumaHungarianIcelanderIndian (Asian)IndonesianInupiatIranianIraqiIrishIroquoisIsraeliItalianJamaicanJapaneseJordanianKenyanKiowaKoreanLaotianLatvianLebaneseLiberianLithuanianLumbeeLuxembourgerMacedonianMalaysianMalteseMarshalleseMenomineeMexicanMexican American IndianMongolianMoroccanNative HawaiianNavajoNepaleseNew ZealanderNicaraguanNigerianNorthern EuropeanNorwegianOkinawanOsageOttawaPaiutePakistaniPalestinianPanamanianParaguayanPennsylvania GermanPeruvianPimaPolishPortuguesePotawatomiPuebloPuerto RicanPuget Sound SalishRomanianRussianSalvadoranSamoanScandinavianScotch-IrishScottishSeminoleSenegaleseSerbianShoshoneSierra LeoneanSiouxSlavicSlovakSloveneSomaliSouth AfricanSouth AmericanSouth American IndianSoviet UnionSpaniardSpanishSpanish AmericanSpanish American IndianSri LankanSubsaharan AfricanSudaneseSwedishSwissSyrianTaiwaneseThaiTlingit-HaidaTohono O'OdhamTonganTrinidadian and TobagonianTsimshianTurkishU.S. Virgin IslanderUgandanUkrainianUruguayanUteVenezuelanVietnameseWelshWest IndianYakamaYaquiYugoslavianYumanYup'ikZimbabwean
Immigration
NonimmigrantsImmigrantsAfghanistanAfricaAlbaniaArgentinaArmeniaAsiaAustraliaAustriaBahamasBangladeshBarbadosBelarusBelgiumBelizeBoliviaBosnia and HerzegovinaBrazilBulgariaBurma/MyanmarCabo VerdeCambodiaCameroonCanadaCaribbeanCentral AmericaChileChinaColombiaCongoCosta RicaCroatiaCubaCzechoslovakiaDenmarkDominicaDominican RepublicEastern AfricaEastern AsiaEastern EuropeEcuadorEgyptEl SalvadorEnglandEritreaEthiopiaEuropeFijiFranceGermanyGhanaGreeceGrenadaGuatemalaGuyanaHaitiHondurasHong KongHungaryIndiaIndonesiaIranIraqIrelandIsraelItalyJamaicaJapanJordanKazakhstanKenyaKoreaKuwaitLaosLatin AmericaLatviaLebanonLiberiaLithuaniaMalaysiaMexicoMicronesiaMiddle AfricaMoldovaMoroccoNepalNetherlandsNicaraguaNigeriaNorth AmericaNorth MacedoniaNorthern AfricaNorthern EuropeNorwayOceaniaPakistanPanamaPeruPhilippinesPolandPortugalRomaniaRussiaSaudi ArabiaScotlandSenegalSerbiaSierra LeoneSingaporeSomaliaSouth AfricaSouth AmericaSouth Central AsiaSouth Eastern AsiaSouthern EuropeSpainSri LankaSt. Vincent and the GrenadinesSudanSwedenSwitzerlandSyriaTaiwanThailandTrinidad and TobagoTurkeyUgandaUkraineUruguayUzbekistanVenezuelaVietnamWestern AfricaWestern AsiaWestern EuropeYemenZaireZimbabweAzores
Female Poverty Among 25-34 Year Olds
Income
Poverty
Unemployment
Labor Participation
Family Structure
Vehicle Availability
Education Level
Disability

Female Poverty Among 25-34 Year Olds Comparison

Immigrants from West Indies

Assyrians/Chaldeans/Syriacs

Tragic
Exceptional
15.1%
FEMALE POVERTY AMONG 25-34 YEAR OLDS
0.4/ 100
METRIC RATING
253rd/ 347
METRIC RANK
11.2%
FEMALE POVERTY AMONG 25-34 YEAR OLDS
100.0/ 100
METRIC RATING
15th/ 347
METRIC RANK

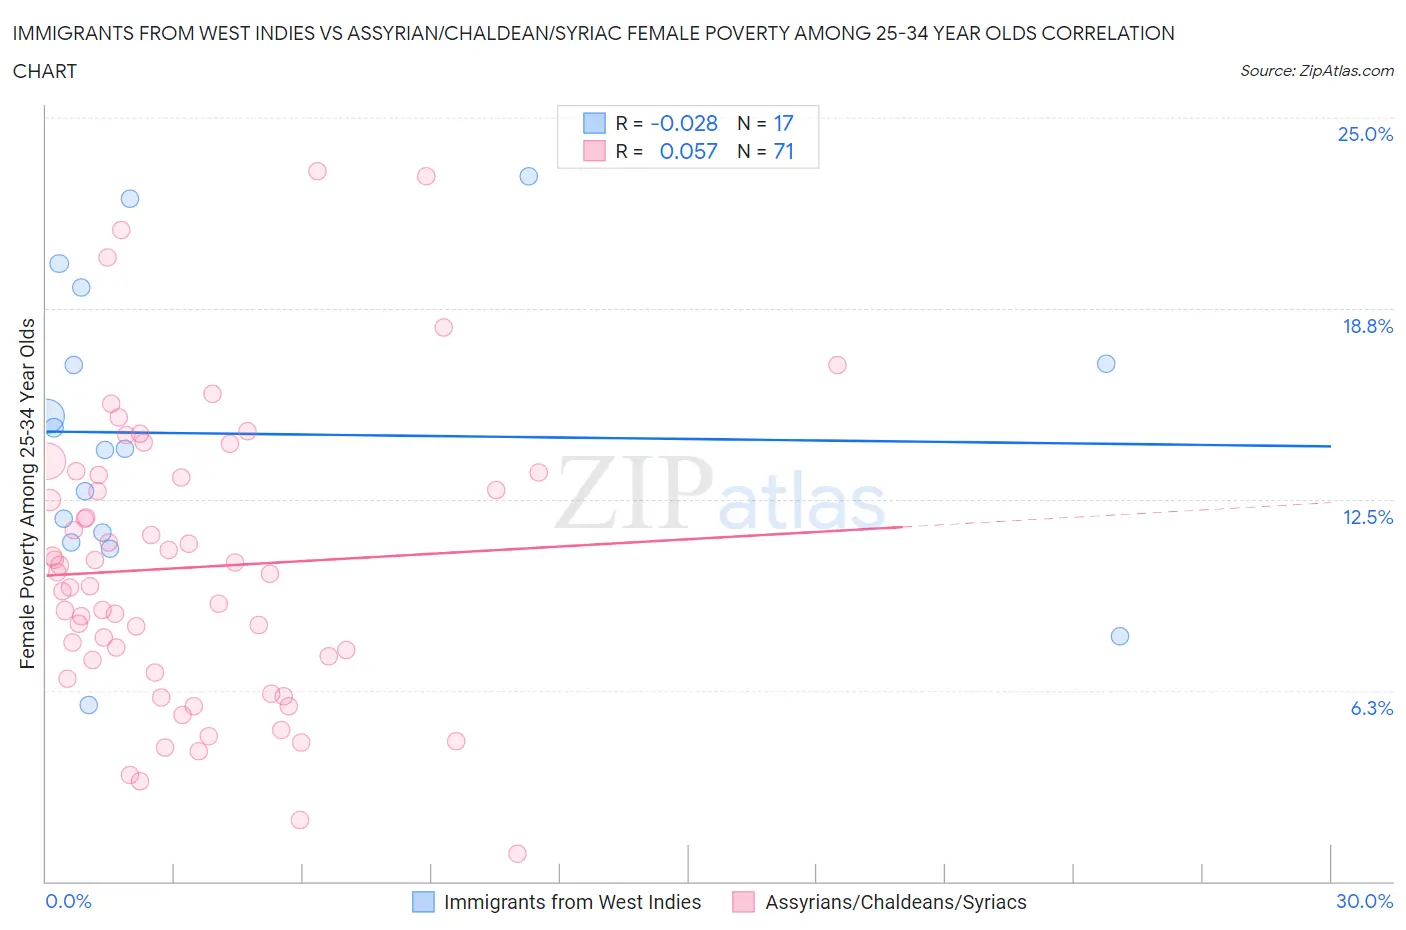
Immigrants from West Indies vs Assyrian/Chaldean/Syriac Female Poverty Among 25-34 Year Olds Correlation Chart

The statistical analysis conducted on geographies consisting of 72,346,963 people shows no correlation between the proportion of Immigrants from West Indies and poverty level among females between the ages 25 and 34 in the United States with a correlation coefficient (R) of -0.028 and weighted average of 15.1%. Similarly, the statistical analysis conducted on geographies consisting of 109,704,517 people shows a slight positive correlation between the proportion of Assyrians/Chaldeans/Syriacs and poverty level among females between the ages 25 and 34 in the United States with a correlation coefficient (R) of 0.057 and weighted average of 11.2%, a difference of 34.8%.
Immigrants from West Indies vs Assyrian/Chaldean/Syriac Female Poverty Among 25-34 Year Olds

Female Poverty Among 25-34 Year Olds Correlation Summary

MeasurementImmigrants from West IndiesAssyrian/Chaldean/Syriac
Minimum5.8%0.92%
Maximum23.1%23.2%
Range17.3%22.3%
Mean14.6%10.3%
Median14.2%10.1%
Interquartile 25% (IQ1)11.3%6.8%
Interquartile 75% (IQ3)18.2%13.3%
Interquartile Range (IQR)6.9%6.5%
Standard Deviation (Sample)4.8%4.7%
Standard Deviation (Population)4.6%4.7%

Similar Demographics by Female Poverty Among 25-34 Year Olds

Demographics Similar to Immigrants from West Indies by Female Poverty Among 25-34 Year Olds

In terms of female poverty among 25-34 year olds, the demographic groups most similar to Immigrants from West Indies are Somali (15.1%, a difference of 0.080%), Belizean (15.1%, a difference of 0.14%), Haitian (15.0%, a difference of 0.31%), Immigrants from Laos (15.2%, a difference of 0.47%), and Immigrants from El Salvador (15.0%, a difference of 0.50%).
DemographicsRating | RankFemale Poverty Among 25-34 Year Olds
Jamaicans
1.0
/100
|
#246
Tragic
14.8%
German Russians
0.8
/100
|
#247
Tragic
14.9%
Immigrants | Western Africa
0.8
/100
|
#248
Tragic
14.9%
Immigrants | Haiti
0.5
/100
|
#249
Tragic
15.0%
Immigrants | El Salvador
0.5
/100
|
#250
Tragic
15.0%
Haitians
0.5
/100
|
#251
Tragic
15.0%
Belizeans
0.4
/100
|
#252
Tragic
15.1%
Immigrants | West Indies
0.4
/100
|
#253
Tragic
15.1%
Somalis
0.4
/100
|
#254
Tragic
15.1%
Immigrants | Laos
0.3
/100
|
#255
Tragic
15.2%
West Indians
0.3
/100
|
#256
Tragic
15.2%
Immigrants | Burma/Myanmar
0.3
/100
|
#257
Tragic
15.2%
Nepalese
0.2
/100
|
#258
Tragic
15.2%
Immigrants | Cuba
0.2
/100
|
#259
Tragic
15.2%
Marshallese
0.2
/100
|
#260
Tragic
15.3%

Demographics Similar to Assyrians/Chaldeans/Syriacs by Female Poverty Among 25-34 Year Olds

In terms of female poverty among 25-34 year olds, the demographic groups most similar to Assyrians/Chaldeans/Syriacs are Immigrants from Bolivia (11.2%, a difference of 0.040%), Burmese (11.2%, a difference of 0.11%), Indian (Asian) (11.2%, a difference of 0.11%), Immigrants from China (11.2%, a difference of 0.11%), and Immigrants from Ireland (11.2%, a difference of 0.22%).
DemographicsRating | RankFemale Poverty Among 25-34 Year Olds
Immigrants | Iran
100.0
/100
|
#8
Exceptional
11.0%
Immigrants | Singapore
100.0
/100
|
#9
Exceptional
11.1%
Immigrants | Lithuania
100.0
/100
|
#10
Exceptional
11.1%
Immigrants | Korea
100.0
/100
|
#11
Exceptional
11.1%
Immigrants | Ireland
100.0
/100
|
#12
Exceptional
11.2%
Burmese
100.0
/100
|
#13
Exceptional
11.2%
Indians (Asian)
100.0
/100
|
#14
Exceptional
11.2%
Assyrians/Chaldeans/Syriacs
100.0
/100
|
#15
Exceptional
11.2%
Immigrants | Bolivia
100.0
/100
|
#16
Exceptional
11.2%
Immigrants | China
100.0
/100
|
#17
Exceptional
11.2%
Immigrants | Eastern Asia
100.0
/100
|
#18
Exceptional
11.2%
Iranians
100.0
/100
|
#19
Exceptional
11.2%
Okinawans
100.0
/100
|
#20
Exceptional
11.3%
Turks
100.0
/100
|
#21
Exceptional
11.4%
Asians
99.9
/100
|
#22
Exceptional
11.4%