Immigrants from Venezuela vs Japanese Female Poverty Among 25-34 Year Olds

COMPARE

Immigrants from Venezuela
Race
Ancestry
AfghanAfricanAlaska NativeAlaskan AthabascanAlbanianAleutAlsatianAmericanApacheArabArapahoArgentineanArmenianAssyrian/Chaldean/SyriacAustralianAustrianBahamianBangladeshiBarbadianBasqueBelgianBelizeanBermudanBhutaneseBlackfeetBolivianBrazilianBritishBritish West IndianBulgarianBurmeseCajunCambodianCanadianCape VerdeanCarpatho RusynCelticCentral AmericanCentral American IndianCherokeeCheyenneChickasawChileanChineseChippewaChoctawColombianColvilleComancheCosta RicanCreeCreekCroatianCrowCubanCypriotCzechCzechoslovakianDanishDelawareDominicanDutchDutch West IndianEastern EuropeanEcuadorianEgyptianEnglishEstonianEthiopianEuropeanFijianFilipinoFinnishFrenchFrench American IndianFrench CanadianGermanGerman RussianGhanaianGreekGuamanian/ChamorroGuatemalanGuyaneseHaitianHmongHonduranHopiHoumaHungarianIcelanderIndian (Asian)IndonesianInupiatIranianIraqiIrishIroquoisIsraeliItalianJamaicanJordanianKenyanKiowaKoreanLaotianLatvianLebaneseLiberianLithuanianLumbeeLuxembourgerMacedonianMalaysianMalteseMarshalleseMenomineeMexicanMexican American IndianMongolianMoroccanNative HawaiianNavajoNepaleseNew ZealanderNicaraguanNigerianNorthern EuropeanNorwegianOkinawanOsageOttawaPaiutePakistaniPalestinianPanamanianParaguayanPennsylvania GermanPeruvianPimaPolishPortuguesePotawatomiPuebloPuerto RicanPuget Sound SalishRomanianRussianSalvadoranSamoanScandinavianScotch-IrishScottishSeminoleSenegaleseSerbianShoshoneSierra LeoneanSiouxSlavicSlovakSloveneSomaliSouth AfricanSouth AmericanSouth American IndianSoviet UnionSpaniardSpanishSpanish AmericanSpanish American IndianSri LankanSubsaharan AfricanSudaneseSwedishSwissSyrianTaiwaneseThaiTlingit-HaidaTohono O'OdhamTonganTrinidadian and TobagonianTsimshianTurkishU.S. Virgin IslanderUgandanUkrainianUruguayanUteVenezuelanVietnameseWelshWest IndianYakamaYaquiYugoslavianYumanYup'ikZimbabwean
Immigration
NonimmigrantsImmigrantsAfghanistanAfricaAlbaniaArgentinaArmeniaAsiaAustraliaAustriaBahamasBangladeshBarbadosBelarusBelgiumBelizeBoliviaBosnia and HerzegovinaBrazilBulgariaBurma/MyanmarCabo VerdeCambodiaCameroonCanadaCaribbeanCentral AmericaChileChinaColombiaCongoCosta RicaCroatiaCubaCzechoslovakiaDenmarkDominicaDominican RepublicEastern AfricaEastern AsiaEastern EuropeEcuadorEgyptEl SalvadorEnglandEritreaEthiopiaEuropeFijiFranceGermanyGhanaGreeceGrenadaGuatemalaGuyanaHaitiHondurasHong KongHungaryIndiaIndonesiaIranIraqIrelandIsraelItalyJamaicaJapanJordanKazakhstanKenyaKoreaKuwaitLaosLatin AmericaLatviaLebanonLiberiaLithuaniaMalaysiaMexicoMicronesiaMiddle AfricaMoldovaMoroccoNepalNetherlandsNicaraguaNigeriaNorth AmericaNorth MacedoniaNorthern AfricaNorthern EuropeNorwayOceaniaPakistanPanamaPeruPhilippinesPolandPortugalRomaniaRussiaSaudi ArabiaScotlandSenegalSerbiaSierra LeoneSingaporeSomaliaSouth AfricaSouth AmericaSouth Central AsiaSouth Eastern AsiaSouthern EuropeSpainSri LankaSt. Vincent and the GrenadinesSudanSwedenSwitzerlandSyriaTaiwanThailandTrinidad and TobagoTurkeyUgandaUkraineUruguayUzbekistanVenezuelaVietnamWest IndiesWestern AfricaWestern AsiaWestern EuropeYemenZaireZimbabweAzores
Japanese
Race
Ancestry
AfghanAfricanAlaska NativeAlaskan AthabascanAlbanianAleutAlsatianAmericanApacheArabArapahoArgentineanArmenianAssyrian/Chaldean/SyriacAustralianAustrianBahamianBangladeshiBarbadianBasqueBelgianBelizeanBermudanBhutaneseBlackfeetBolivianBrazilianBritishBritish West IndianBulgarianBurmeseCajunCambodianCanadianCape VerdeanCarpatho RusynCelticCentral AmericanCentral American IndianCherokeeCheyenneChickasawChileanChineseChippewaChoctawColombianColvilleComancheCosta RicanCreeCreekCroatianCrowCubanCypriotCzechCzechoslovakianDanishDelawareDominicanDutchDutch West IndianEastern EuropeanEcuadorianEgyptianEnglishEstonianEthiopianEuropeanFijianFilipinoFinnishFrenchFrench American IndianFrench CanadianGermanGerman RussianGhanaianGreekGuamanian/ChamorroGuatemalanGuyaneseHaitianHmongHonduranHopiHoumaHungarianIcelanderIndian (Asian)IndonesianInupiatIranianIraqiIrishIroquoisIsraeliItalianJamaicanJapaneseJordanianKenyanKiowaKoreanLaotianLatvianLebaneseLiberianLithuanianLumbeeLuxembourgerMacedonianMalaysianMalteseMarshalleseMenomineeMexicanMexican American IndianMongolianMoroccanNative HawaiianNavajoNepaleseNew ZealanderNicaraguanNigerianNorthern EuropeanNorwegianOkinawanOsageOttawaPaiutePakistaniPalestinianPanamanianParaguayanPennsylvania GermanPeruvianPimaPolishPortuguesePotawatomiPuebloPuerto RicanPuget Sound SalishRomanianRussianSalvadoranSamoanScandinavianScotch-IrishScottishSeminoleSenegaleseSerbianShoshoneSierra LeoneanSiouxSlavicSlovakSloveneSomaliSouth AfricanSouth AmericanSouth American IndianSoviet UnionSpaniardSpanishSpanish AmericanSpanish American IndianSri LankanSubsaharan AfricanSudaneseSwedishSwissSyrianTaiwaneseThaiTlingit-HaidaTohono O'OdhamTonganTrinidadian and TobagonianTsimshianTurkishU.S. Virgin IslanderUgandanUkrainianUruguayanUteVenezuelanVietnameseWelshWest IndianYakamaYaquiYugoslavianYumanYup'ikZimbabwean
Immigration
NonimmigrantsImmigrantsAfghanistanAfricaAlbaniaArgentinaArmeniaAsiaAustraliaAustriaBahamasBangladeshBarbadosBelarusBelgiumBelizeBoliviaBosnia and HerzegovinaBrazilBulgariaBurma/MyanmarCabo VerdeCambodiaCameroonCanadaCaribbeanCentral AmericaChileChinaColombiaCongoCosta RicaCroatiaCubaCzechoslovakiaDenmarkDominicaDominican RepublicEastern AfricaEastern AsiaEastern EuropeEcuadorEgyptEl SalvadorEnglandEritreaEthiopiaEuropeFijiFranceGermanyGhanaGreeceGrenadaGuatemalaGuyanaHaitiHondurasHong KongHungaryIndiaIndonesiaIranIraqIrelandIsraelItalyJamaicaJapanJordanKazakhstanKenyaKoreaKuwaitLaosLatin AmericaLatviaLebanonLiberiaLithuaniaMalaysiaMexicoMicronesiaMiddle AfricaMoldovaMoroccoNepalNetherlandsNicaraguaNigeriaNorth AmericaNorth MacedoniaNorthern AfricaNorthern EuropeNorwayOceaniaPakistanPanamaPeruPhilippinesPolandPortugalRomaniaRussiaSaudi ArabiaScotlandSenegalSerbiaSierra LeoneSingaporeSomaliaSouth AfricaSouth AmericaSouth Central AsiaSouth Eastern AsiaSouthern EuropeSpainSri LankaSt. Vincent and the GrenadinesSudanSwedenSwitzerlandSyriaTaiwanThailandTrinidad and TobagoTurkeyUgandaUkraineUruguayUzbekistanVietnamWest IndiesWestern AfricaWestern AsiaWestern EuropeYemenZaireZimbabweAzores
Female Poverty Among 25-34 Year Olds
Income
Poverty
Unemployment
Labor Participation
Family Structure
Vehicle Availability
Education Level
Disability

Female Poverty Among 25-34 Year Olds Comparison

Immigrants from Venezuela

Japanese

Average
Poor
13.6%
FEMALE POVERTY AMONG 25-34 YEAR OLDS
40.7/ 100
METRIC RATING
182nd/ 347
METRIC RANK
14.1%
FEMALE POVERTY AMONG 25-34 YEAR OLDS
11.7/ 100
METRIC RATING
207th/ 347
METRIC RANK

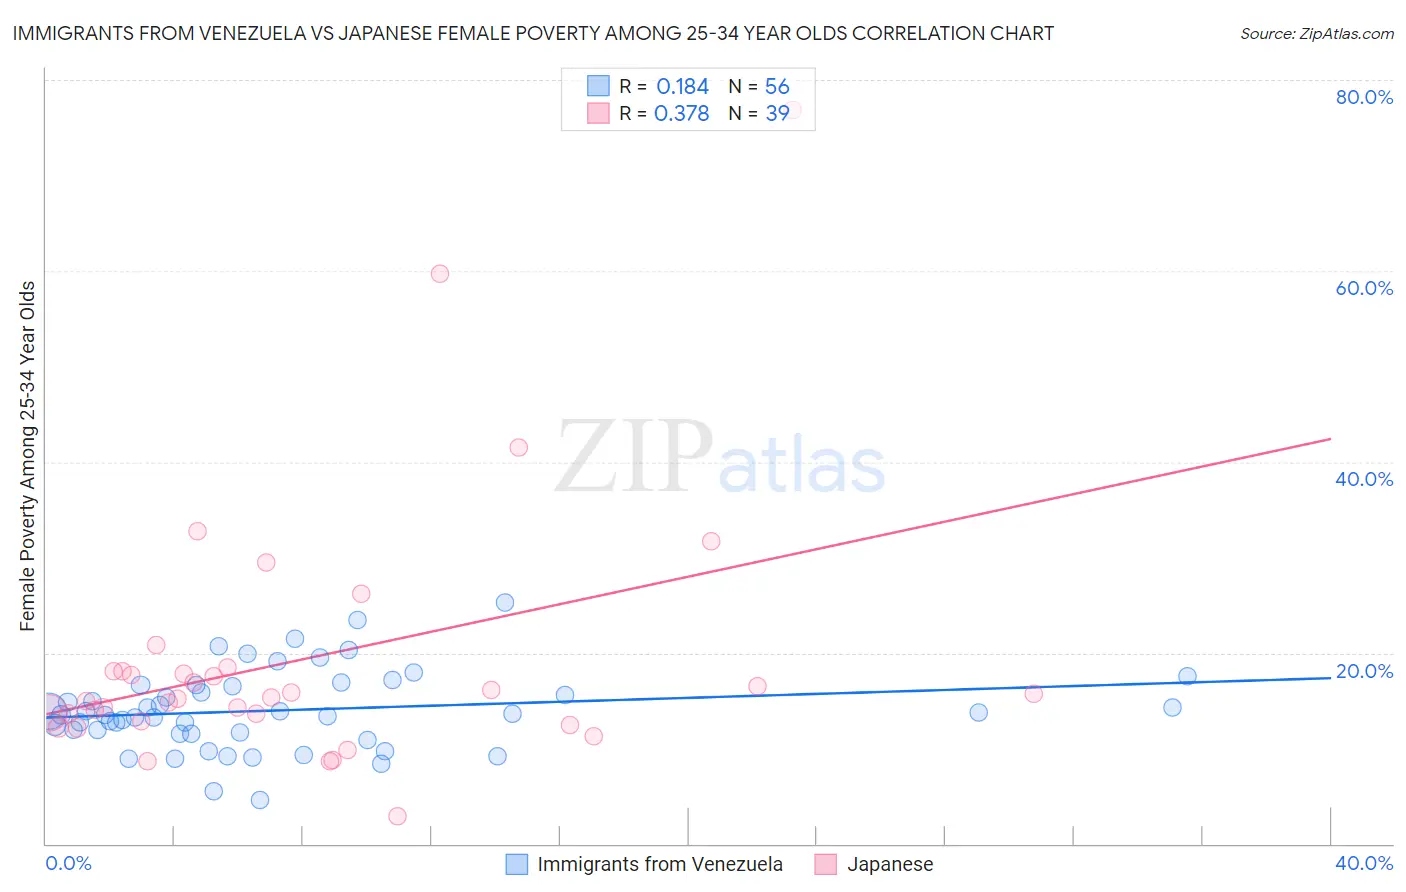
Immigrants from Venezuela vs Japanese Female Poverty Among 25-34 Year Olds Correlation Chart

The statistical analysis conducted on geographies consisting of 285,242,429 people shows a poor positive correlation between the proportion of Immigrants from Venezuela and poverty level among females between the ages 25 and 34 in the United States with a correlation coefficient (R) of 0.184 and weighted average of 13.6%. Similarly, the statistical analysis conducted on geographies consisting of 247,459,659 people shows a mild positive correlation between the proportion of Japanese and poverty level among females between the ages 25 and 34 in the United States with a correlation coefficient (R) of 0.378 and weighted average of 14.1%, a difference of 3.4%.
Immigrants from Venezuela vs Japanese Female Poverty Among 25-34 Year Olds

Female Poverty Among 25-34 Year Olds Correlation Summary

MeasurementImmigrants from VenezuelaJapanese
Minimum4.5%2.8%
Maximum25.3%76.9%
Range20.8%74.1%
Mean14.0%19.3%
Median13.5%15.3%
Interquartile 25% (IQ1)11.6%12.8%
Interquartile 75% (IQ3)16.6%18.1%
Interquartile Range (IQR)4.9%5.3%
Standard Deviation (Sample)4.2%13.8%
Standard Deviation (Population)4.1%13.6%

Similar Demographics by Female Poverty Among 25-34 Year Olds

Demographics Similar to Immigrants from Venezuela by Female Poverty Among 25-34 Year Olds

In terms of female poverty among 25-34 year olds, the demographic groups most similar to Immigrants from Venezuela are Portuguese (13.6%, a difference of 0.030%), German (13.6%, a difference of 0.070%), Guamanian/Chamorro (13.6%, a difference of 0.070%), Immigrants from Eastern Africa (13.6%, a difference of 0.24%), and Canadian (13.6%, a difference of 0.30%).
DemographicsRating | RankFemale Poverty Among 25-34 Year Olds
Bermudans
46.8
/100
|
#175
Average
13.6%
Yugoslavians
45.0
/100
|
#176
Average
13.6%
Venezuelans
44.6
/100
|
#177
Average
13.6%
Canadians
44.3
/100
|
#178
Average
13.6%
Immigrants | Eastern Africa
43.6
/100
|
#179
Average
13.6%
Germans
41.6
/100
|
#180
Average
13.6%
Guamanians/Chamorros
41.5
/100
|
#181
Average
13.6%
Immigrants | Venezuela
40.7
/100
|
#182
Average
13.6%
Portuguese
40.3
/100
|
#183
Average
13.6%
Czechoslovakians
36.8
/100
|
#184
Fair
13.7%
Irish
35.3
/100
|
#185
Fair
13.7%
Immigrants | Uruguay
34.1
/100
|
#186
Fair
13.7%
Slovaks
34.1
/100
|
#187
Fair
13.7%
Immigrants | Eritrea
32.7
/100
|
#188
Fair
13.7%
Finns
32.5
/100
|
#189
Fair
13.7%

Demographics Similar to Japanese by Female Poverty Among 25-34 Year Olds

In terms of female poverty among 25-34 year olds, the demographic groups most similar to Japanese are Hungarian (14.1%, a difference of 0.020%), Immigrants from Panama (14.1%, a difference of 0.020%), Immigrants from Africa (14.1%, a difference of 0.30%), Hawaiian (14.1%, a difference of 0.35%), and Immigrants (14.0%, a difference of 0.49%).
DemographicsRating | RankFemale Poverty Among 25-34 Year Olds
Hmong
20.3
/100
|
#200
Fair
13.9%
Immigrants | Trinidad and Tobago
17.6
/100
|
#201
Poor
14.0%
Welsh
17.2
/100
|
#202
Poor
14.0%
Immigrants | Immigrants
14.5
/100
|
#203
Poor
14.0%
Hawaiians
13.6
/100
|
#204
Poor
14.1%
Immigrants | Africa
13.4
/100
|
#205
Poor
14.1%
Hungarians
11.8
/100
|
#206
Poor
14.1%
Japanese
11.7
/100
|
#207
Poor
14.1%
Immigrants | Panama
11.6
/100
|
#208
Poor
14.1%
Guyanese
8.6
/100
|
#209
Tragic
14.2%
Panamanians
8.6
/100
|
#210
Tragic
14.2%
Trinidadians and Tobagonians
8.2
/100
|
#211
Tragic
14.2%
Immigrants | Guyana
6.6
/100
|
#212
Tragic
14.3%
Puget Sound Salish
6.5
/100
|
#213
Tragic
14.3%
French
6.2
/100
|
#214
Tragic
14.3%