Immigrants from Uruguay vs Yuman Child Poverty Among Boys Under 16

COMPARE

Immigrants from Uruguay
Race
Ancestry
AfghanAfricanAlaska NativeAlaskan AthabascanAlbanianAleutAlsatianAmericanApacheArabArapahoArgentineanArmenianAssyrian/Chaldean/SyriacAustralianAustrianBahamianBangladeshiBarbadianBasqueBelgianBelizeanBermudanBhutaneseBlackfeetBolivianBrazilianBritishBritish West IndianBulgarianBurmeseCajunCambodianCanadianCape VerdeanCarpatho RusynCelticCentral AmericanCentral American IndianCherokeeCheyenneChickasawChileanChineseChippewaChoctawColombianColvilleComancheCosta RicanCreeCreekCroatianCrowCubanCypriotCzechCzechoslovakianDanishDelawareDominicanDutchDutch West IndianEastern EuropeanEcuadorianEgyptianEnglishEstonianEthiopianEuropeanFijianFilipinoFinnishFrenchFrench American IndianFrench CanadianGermanGerman RussianGhanaianGreekGuamanian/ChamorroGuatemalanGuyaneseHaitianHmongHonduranHopiHoumaHungarianIcelanderIndian (Asian)IndonesianInupiatIranianIraqiIrishIroquoisIsraeliItalianJamaicanJapaneseJordanianKenyanKiowaKoreanLaotianLatvianLebaneseLiberianLithuanianLumbeeLuxembourgerMacedonianMalaysianMalteseMarshalleseMenomineeMexicanMexican American IndianMongolianMoroccanNative HawaiianNavajoNepaleseNew ZealanderNicaraguanNigerianNorthern EuropeanNorwegianOkinawanOsageOttawaPaiutePakistaniPalestinianPanamanianParaguayanPennsylvania GermanPeruvianPimaPolishPortuguesePotawatomiPuebloPuerto RicanPuget Sound SalishRomanianRussianSalvadoranSamoanScandinavianScotch-IrishScottishSeminoleSenegaleseSerbianShoshoneSierra LeoneanSiouxSlavicSlovakSloveneSomaliSouth AfricanSouth AmericanSouth American IndianSoviet UnionSpaniardSpanishSpanish AmericanSpanish American IndianSri LankanSubsaharan AfricanSudaneseSwedishSwissSyrianTaiwaneseThaiTlingit-HaidaTohono O'OdhamTonganTrinidadian and TobagonianTsimshianTurkishU.S. Virgin IslanderUgandanUkrainianUruguayanUteVenezuelanVietnameseWelshWest IndianYakamaYaquiYugoslavianYup'ikZimbabwean
Immigration
NonimmigrantsImmigrantsAfghanistanAfricaAlbaniaArgentinaArmeniaAsiaAustraliaAustriaBahamasBangladeshBarbadosBelarusBelgiumBelizeBoliviaBosnia and HerzegovinaBrazilBulgariaBurma/MyanmarCabo VerdeCambodiaCameroonCanadaCaribbeanCentral AmericaChileChinaColombiaCongoCosta RicaCroatiaCubaCzechoslovakiaDenmarkDominicaDominican RepublicEastern AfricaEastern AsiaEastern EuropeEcuadorEgyptEl SalvadorEnglandEritreaEthiopiaEuropeFijiFranceGermanyGhanaGreeceGrenadaGuatemalaGuyanaHaitiHondurasHong KongHungaryIndiaIndonesiaIranIraqIrelandIsraelItalyJamaicaJapanJordanKazakhstanKenyaKoreaKuwaitLaosLatin AmericaLatviaLebanonLiberiaLithuaniaMalaysiaMexicoMicronesiaMiddle AfricaMoldovaMoroccoNepalNetherlandsNicaraguaNigeriaNorth AmericaNorth MacedoniaNorthern AfricaNorthern EuropeNorwayOceaniaPakistanPanamaPeruPhilippinesPolandPortugalRomaniaRussiaSaudi ArabiaScotlandSenegalSerbiaSierra LeoneSingaporeSomaliaSouth AfricaSouth AmericaSouth Central AsiaSouth Eastern AsiaSouthern EuropeSpainSri LankaSt. Vincent and the GrenadinesSudanSwedenSwitzerlandSyriaTaiwanThailandTrinidad and TobagoTurkeyUgandaUkraineUruguayUzbekistanVenezuelaVietnamWest IndiesWestern AfricaWestern AsiaWestern EuropeYemenZaireZimbabweAzores
Yuman
Race
Ancestry
AfghanAfricanAlaska NativeAlaskan AthabascanAlbanianAleutAlsatianAmericanApacheArabArapahoArgentineanArmenianAssyrian/Chaldean/SyriacAustralianAustrianBahamianBangladeshiBarbadianBasqueBelgianBelizeanBermudanBhutaneseBlackfeetBolivianBrazilianBritishBritish West IndianBulgarianBurmeseCajunCambodianCanadianCape VerdeanCarpatho RusynCelticCentral AmericanCentral American IndianCherokeeCheyenneChickasawChileanChineseChippewaChoctawColombianColvilleComancheCosta RicanCreeCreekCroatianCrowCubanCypriotCzechCzechoslovakianDanishDelawareDominicanDutchDutch West IndianEastern EuropeanEcuadorianEgyptianEnglishEstonianEthiopianEuropeanFijianFilipinoFinnishFrenchFrench American IndianFrench CanadianGermanGerman RussianGhanaianGreekGuamanian/ChamorroGuatemalanGuyaneseHaitianHmongHonduranHopiHoumaHungarianIcelanderIndian (Asian)IndonesianInupiatIranianIraqiIrishIroquoisIsraeliItalianJamaicanJapaneseJordanianKenyanKiowaKoreanLaotianLatvianLebaneseLiberianLithuanianLumbeeLuxembourgerMacedonianMalaysianMalteseMarshalleseMenomineeMexicanMexican American IndianMongolianMoroccanNative HawaiianNavajoNepaleseNew ZealanderNicaraguanNigerianNorthern EuropeanNorwegianOkinawanOsageOttawaPaiutePakistaniPalestinianPanamanianParaguayanPennsylvania GermanPeruvianPimaPolishPortuguesePotawatomiPuebloPuerto RicanPuget Sound SalishRomanianRussianSalvadoranSamoanScandinavianScotch-IrishScottishSeminoleSenegaleseSerbianShoshoneSierra LeoneanSiouxSlavicSlovakSloveneSomaliSouth AfricanSouth AmericanSouth American IndianSoviet UnionSpaniardSpanishSpanish AmericanSpanish American IndianSri LankanSubsaharan AfricanSudaneseSwedishSwissSyrianTaiwaneseThaiTlingit-HaidaTohono O'OdhamTonganTrinidadian and TobagonianTsimshianTurkishU.S. Virgin IslanderUgandanUkrainianUruguayanUteVenezuelanVietnameseWelshWest IndianYakamaYaquiYugoslavianYumanYup'ikZimbabwean
Immigration
NonimmigrantsImmigrantsAfghanistanAfricaAlbaniaArgentinaArmeniaAsiaAustraliaAustriaBahamasBangladeshBarbadosBelarusBelgiumBelizeBoliviaBosnia and HerzegovinaBrazilBulgariaBurma/MyanmarCabo VerdeCambodiaCameroonCanadaCaribbeanCentral AmericaChileChinaColombiaCongoCosta RicaCroatiaCubaCzechoslovakiaDenmarkDominicaDominican RepublicEastern AfricaEastern AsiaEastern EuropeEcuadorEgyptEl SalvadorEnglandEritreaEthiopiaEuropeFijiFranceGermanyGhanaGreeceGrenadaGuatemalaGuyanaHaitiHondurasHong KongHungaryIndiaIndonesiaIranIraqIrelandIsraelItalyJamaicaJapanJordanKazakhstanKenyaKoreaKuwaitLaosLatin AmericaLatviaLebanonLiberiaLithuaniaMalaysiaMexicoMicronesiaMiddle AfricaMoldovaMoroccoNepalNetherlandsNicaraguaNigeriaNorth AmericaNorth MacedoniaNorthern AfricaNorthern EuropeNorwayOceaniaPakistanPanamaPeruPhilippinesPolandPortugalRomaniaRussiaSaudi ArabiaScotlandSenegalSerbiaSierra LeoneSingaporeSomaliaSouth AfricaSouth AmericaSouth Central AsiaSouth Eastern AsiaSouthern EuropeSpainSri LankaSt. Vincent and the GrenadinesSudanSwedenSwitzerlandSyriaTaiwanThailandTrinidad and TobagoTurkeyUgandaUkraineUzbekistanVenezuelaVietnamWest IndiesWestern AfricaWestern AsiaWestern EuropeYemenZaireZimbabweAzores
Child Poverty Among Boys Under 16
Income
Poverty
Unemployment
Labor Participation
Family Structure
Vehicle Availability
Education Level
Disability

Child Poverty Among Boys Under 16 Comparison

Immigrants from Uruguay

Yuman

Poor
Tragic
17.2%
CHILD POVERTY AMONG BOYS UNDER 16
16.9/ 100
METRIC RATING
200th/ 347
METRIC RANK
30.6%
CHILD POVERTY AMONG BOYS UNDER 16
0.0/ 100
METRIC RATING
344th/ 347
METRIC RANK

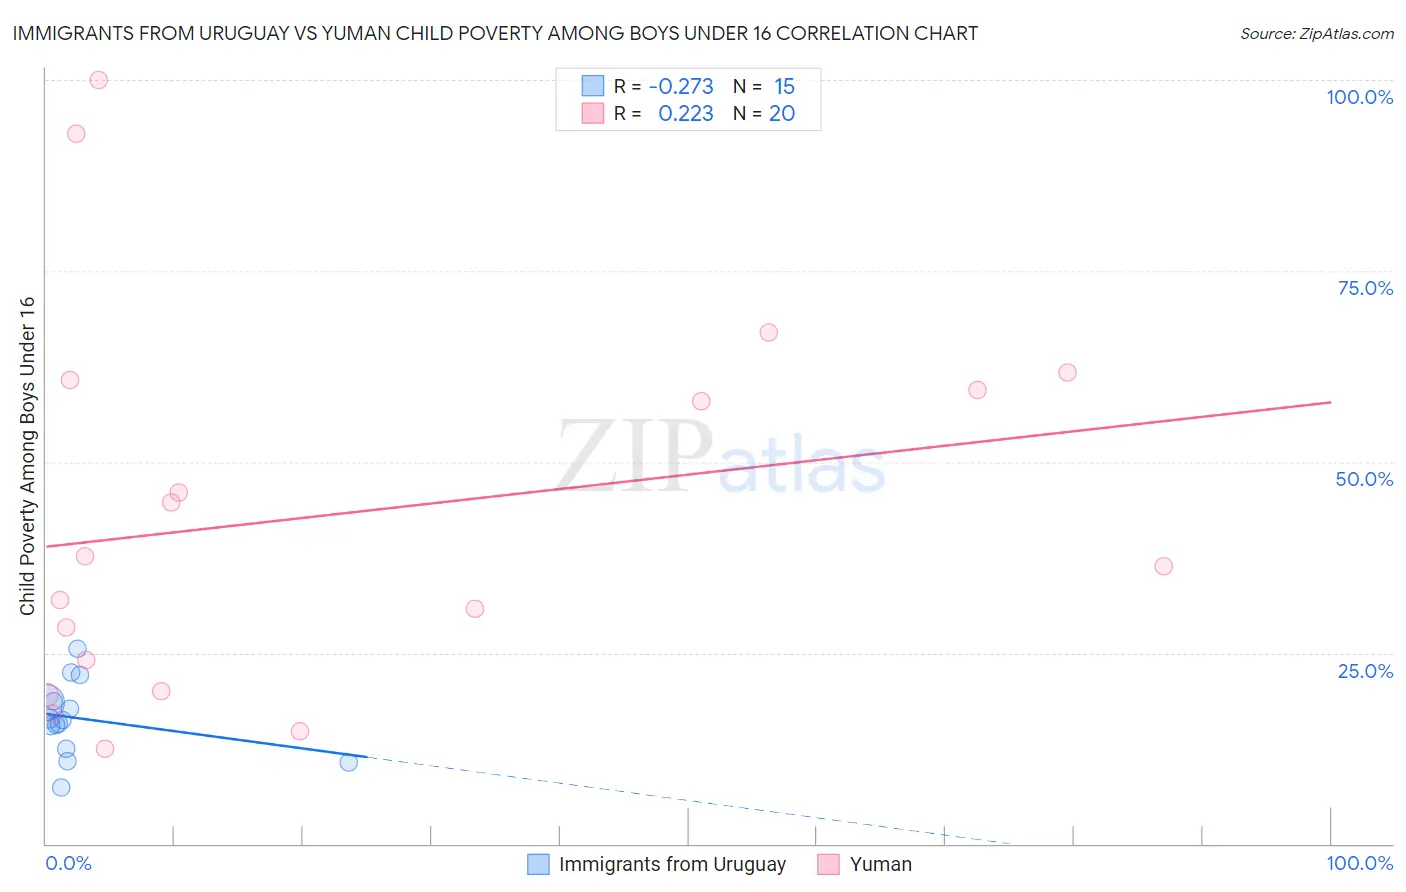
Immigrants from Uruguay vs Yuman Child Poverty Among Boys Under 16 Correlation Chart

The statistical analysis conducted on geographies consisting of 132,601,780 people shows a weak negative correlation between the proportion of Immigrants from Uruguay and poverty level among boys under the age of 16 in the United States with a correlation coefficient (R) of -0.273 and weighted average of 17.2%. Similarly, the statistical analysis conducted on geographies consisting of 40,605,786 people shows a weak positive correlation between the proportion of Yuman and poverty level among boys under the age of 16 in the United States with a correlation coefficient (R) of 0.223 and weighted average of 30.6%, a difference of 78.5%.
Immigrants from Uruguay vs Yuman Child Poverty Among Boys Under 16

Child Poverty Among Boys Under 16 Correlation Summary

MeasurementImmigrants from UruguayYuman
Minimum7.4%12.5%
Maximum25.6%100.0%
Range18.2%87.5%
Mean16.4%43.2%
Median16.2%37.0%
Interquartile 25% (IQ1)12.5%22.0%
Interquartile 75% (IQ3)18.6%60.0%
Interquartile Range (IQR)6.1%38.0%
Standard Deviation (Sample)4.8%25.0%
Standard Deviation (Population)4.7%24.4%

Similar Demographics by Child Poverty Among Boys Under 16

Demographics Similar to Immigrants from Uruguay by Child Poverty Among Boys Under 16

In terms of child poverty among boys under 16, the demographic groups most similar to Immigrants from Uruguay are Delaware (17.1%, a difference of 0.33%), Immigrants from Cameroon (17.1%, a difference of 0.38%), Immigrants from Kenya (17.1%, a difference of 0.57%), Spaniard (17.1%, a difference of 0.63%), and Spanish (17.0%, a difference of 0.67%).
DemographicsRating | RankChild Poverty Among Boys Under 16
Immigrants | Iraq
21.6
/100
|
#193
Fair
17.0%
Immigrants | Lebanon
21.2
/100
|
#194
Fair
17.0%
Spanish
20.8
/100
|
#195
Fair
17.0%
Spaniards
20.5
/100
|
#196
Fair
17.1%
Immigrants | Kenya
20.1
/100
|
#197
Fair
17.1%
Immigrants | Cameroon
19.0
/100
|
#198
Poor
17.1%
Delaware
18.8
/100
|
#199
Poor
17.1%
Immigrants | Uruguay
16.9
/100
|
#200
Poor
17.2%
Immigrants | Afghanistan
13.7
/100
|
#201
Poor
17.3%
Immigrants | Sierra Leone
13.4
/100
|
#202
Poor
17.3%
Immigrants | Uzbekistan
13.3
/100
|
#203
Poor
17.3%
Ugandans
12.5
/100
|
#204
Poor
17.3%
Immigrants | Portugal
11.2
/100
|
#205
Poor
17.4%
German Russians
10.9
/100
|
#206
Poor
17.4%
Immigrants | Thailand
8.2
/100
|
#207
Tragic
17.5%

Demographics Similar to Yuman by Child Poverty Among Boys Under 16

In terms of child poverty among boys under 16, the demographic groups most similar to Yuman are Navajo (30.3%, a difference of 1.2%), Tohono O'odham (31.6%, a difference of 3.0%), Pima (29.7%, a difference of 3.0%), Lumbee (31.9%, a difference of 4.2%), and Immigrants from Yemen (28.9%, a difference of 6.2%).
DemographicsRating | RankChild Poverty Among Boys Under 16
Apache
0.0
/100
|
#333
Tragic
24.5%
Blacks/African Americans
0.0
/100
|
#334
Tragic
24.5%
Yup'ik
0.0
/100
|
#335
Tragic
24.7%
Sioux
0.0
/100
|
#336
Tragic
25.3%
Cheyenne
0.0
/100
|
#337
Tragic
25.8%
Hopi
0.0
/100
|
#338
Tragic
25.9%
Houma
0.0
/100
|
#339
Tragic
26.2%
Crow
0.0
/100
|
#340
Tragic
26.3%
Immigrants | Yemen
0.0
/100
|
#341
Tragic
28.9%
Pima
0.0
/100
|
#342
Tragic
29.7%
Navajo
0.0
/100
|
#343
Tragic
30.3%
Yuman
0.0
/100
|
#344
Tragic
30.6%
Tohono O'odham
0.0
/100
|
#345
Tragic
31.6%
Lumbee
0.0
/100
|
#346
Tragic
31.9%
Puerto Ricans
0.0
/100
|
#347
Tragic
32.8%