Immigrants from Uruguay vs Salvadoran Child Poverty Under the Age of 16
COMPARE
Immigrants from Uruguay
Salvadoran
Child Poverty Under the Age of 16
Child Poverty Under the Age of 16 Comparison
Immigrants from Uruguay
Salvadorans
16.8%
CHILD POVERTY UNDER THE AGE OF 16
23.1/ 100
METRIC RATING
194th/ 347
METRIC RANK
19.1%
CHILD POVERTY UNDER THE AGE OF 16
0.3/ 100
METRIC RATING
253rd/ 347
METRIC RANK
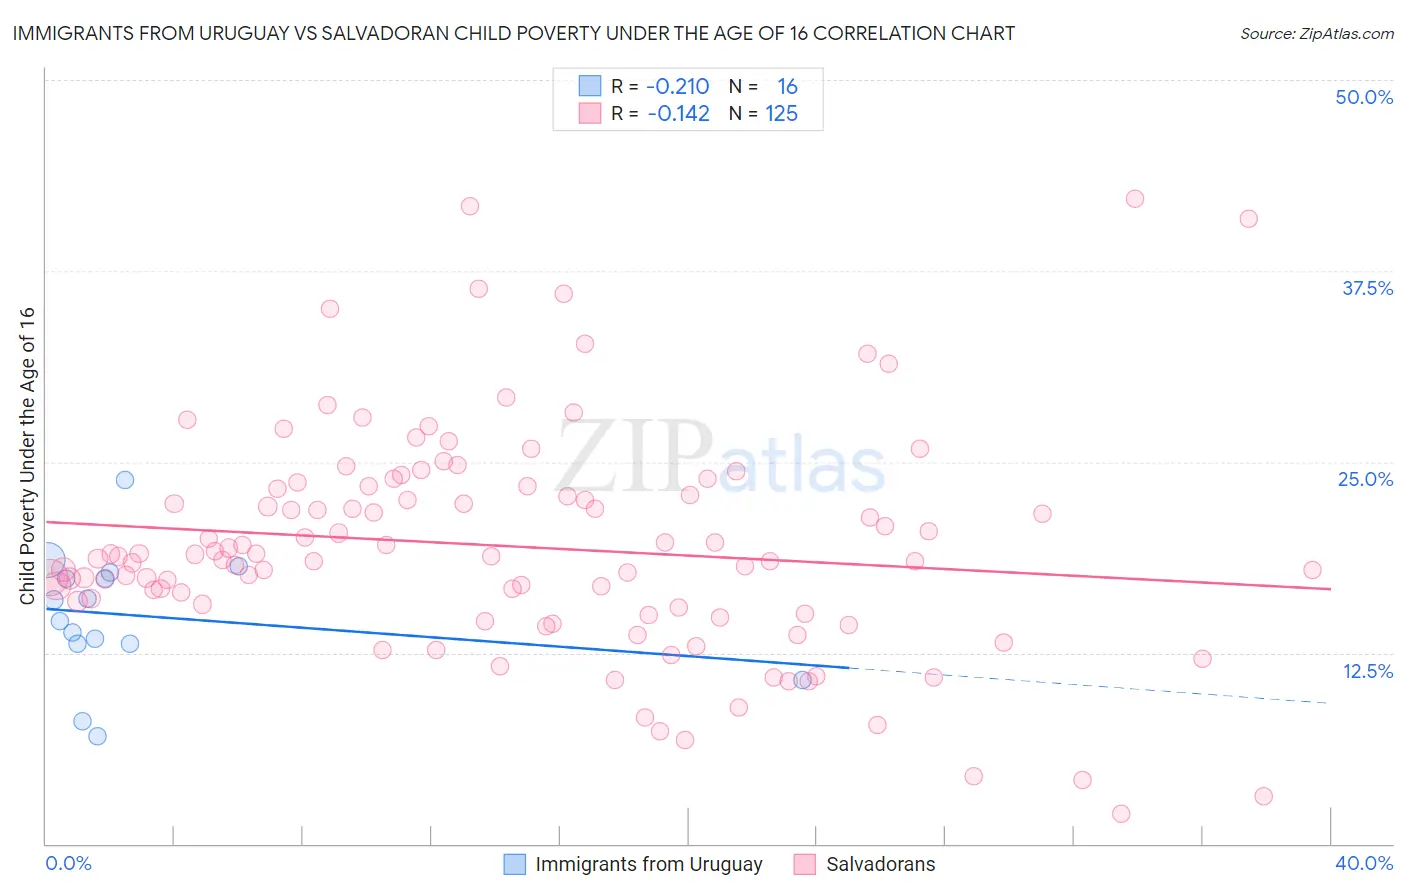
Immigrants from Uruguay vs Salvadoran Child Poverty Under the Age of 16 Correlation Chart
The statistical analysis conducted on geographies consisting of 132,929,464 people shows a weak negative correlation between the proportion of Immigrants from Uruguay and poverty level among children under the age of 16 in the United States with a correlation coefficient (R) of -0.210 and weighted average of 16.8%. Similarly, the statistical analysis conducted on geographies consisting of 396,509,971 people shows a poor negative correlation between the proportion of Salvadorans and poverty level among children under the age of 16 in the United States with a correlation coefficient (R) of -0.142 and weighted average of 19.1%, a difference of 13.8%.
Child Poverty Under the Age of 16 Correlation Summary
| Measurement | Immigrants from Uruguay | Salvadoran |
| Minimum | 7.0% | 1.9% |
| Maximum | 23.8% | 42.2% |
| Range | 16.8% | 40.3% |
| Mean | 14.9% | 19.5% |
| Median | 15.3% | 18.8% |
| Interquartile 25% (IQ1) | 13.1% | 15.2% |
| Interquartile 75% (IQ3) | 17.6% | 23.3% |
| Interquartile Range (IQR) | 4.5% | 8.1% |
| Standard Deviation (Sample) | 4.2% | 7.4% |
| Standard Deviation (Population) | 4.1% | 7.3% |
Similar Demographics by Child Poverty Under the Age of 16
Demographics Similar to Immigrants from Uruguay by Child Poverty Under the Age of 16
In terms of child poverty under the age of 16, the demographic groups most similar to Immigrants from Uruguay are Spaniard (16.8%, a difference of 0.020%), Immigrants from Uganda (16.8%, a difference of 0.090%), Immigrants from Lebanon (16.8%, a difference of 0.17%), Spanish (16.7%, a difference of 0.22%), and Immigrants from Kenya (16.9%, a difference of 0.69%).
| Demographics | Rating | Rank | Child Poverty Under the Age of 16 |
| Arabs | 31.4 /100 | #187 | Fair 16.6% |
| Immigrants | Morocco | 31.2 /100 | #188 | Fair 16.6% |
| Immigrants | Portugal | 30.0 /100 | #189 | Fair 16.6% |
| Immigrants | Costa Rica | 29.6 /100 | #190 | Fair 16.6% |
| Immigrants | Iraq | 28.3 /100 | #191 | Fair 16.7% |
| Spanish | 24.5 /100 | #192 | Fair 16.7% |
| Spaniards | 23.2 /100 | #193 | Fair 16.8% |
| Immigrants | Uruguay | 23.1 /100 | #194 | Fair 16.8% |
| Immigrants | Uganda | 22.5 /100 | #195 | Fair 16.8% |
| Immigrants | Lebanon | 22.0 /100 | #196 | Fair 16.8% |
| Immigrants | Kenya | 19.1 /100 | #197 | Poor 16.9% |
| Delaware | 17.1 /100 | #198 | Poor 17.0% |
| Immigrants | Afghanistan | 15.1 /100 | #199 | Poor 17.0% |
| Immigrants | Cameroon | 14.7 /100 | #200 | Poor 17.1% |
| Immigrants | Uzbekistan | 14.7 /100 | #201 | Poor 17.1% |
Demographics Similar to Salvadorans by Child Poverty Under the Age of 16
In terms of child poverty under the age of 16, the demographic groups most similar to Salvadorans are Immigrants from Trinidad and Tobago (19.1%, a difference of 0.19%), Immigrants from Western Africa (19.2%, a difference of 0.25%), Immigrants from Ghana (19.1%, a difference of 0.26%), Immigrants from Middle Africa (19.0%, a difference of 0.42%), and Trinidadian and Tobagonian (19.2%, a difference of 0.42%).
| Demographics | Rating | Rank | Child Poverty Under the Age of 16 |
| Immigrants | Nicaragua | 0.4 /100 | #246 | Tragic 18.8% |
| French American Indians | 0.4 /100 | #247 | Tragic 18.9% |
| Ecuadorians | 0.3 /100 | #248 | Tragic 19.0% |
| Potawatomi | 0.3 /100 | #249 | Tragic 19.0% |
| Immigrants | Middle Africa | 0.3 /100 | #250 | Tragic 19.0% |
| Immigrants | Ghana | 0.3 /100 | #251 | Tragic 19.1% |
| Immigrants | Trinidad and Tobago | 0.3 /100 | #252 | Tragic 19.1% |
| Salvadorans | 0.3 /100 | #253 | Tragic 19.1% |
| Immigrants | Western Africa | 0.2 /100 | #254 | Tragic 19.2% |
| Trinidadians and Tobagonians | 0.2 /100 | #255 | Tragic 19.2% |
| Inupiat | 0.2 /100 | #256 | Tragic 19.2% |
| Ottawa | 0.2 /100 | #257 | Tragic 19.2% |
| Spanish Americans | 0.2 /100 | #258 | Tragic 19.2% |
| Mexican American Indians | 0.2 /100 | #259 | Tragic 19.3% |
| Guyanese | 0.2 /100 | #260 | Tragic 19.3% |