Immigrants from Turkey vs Immigrants from Moldova Child Poverty Under the Age of 16

COMPARE

Immigrants from Turkey
Race
Ancestry
AfghanAfricanAlaska NativeAlaskan AthabascanAlbanianAleutAlsatianAmericanApacheArabArapahoArgentineanArmenianAssyrian/Chaldean/SyriacAustralianAustrianBahamianBangladeshiBarbadianBasqueBelgianBelizeanBermudanBhutaneseBlackfeetBolivianBrazilianBritishBritish West IndianBulgarianBurmeseCajunCambodianCanadianCape VerdeanCarpatho RusynCelticCentral AmericanCentral American IndianCherokeeCheyenneChickasawChileanChineseChippewaChoctawColombianColvilleComancheCosta RicanCreeCreekCroatianCrowCubanCypriotCzechCzechoslovakianDanishDelawareDominicanDutchDutch West IndianEastern EuropeanEcuadorianEgyptianEnglishEstonianEthiopianEuropeanFijianFilipinoFinnishFrenchFrench American IndianFrench CanadianGermanGerman RussianGhanaianGreekGuamanian/ChamorroGuatemalanGuyaneseHaitianHmongHonduranHopiHoumaHungarianIcelanderIndian (Asian)IndonesianInupiatIranianIraqiIrishIroquoisIsraeliItalianJamaicanJapaneseJordanianKenyanKiowaKoreanLaotianLatvianLebaneseLiberianLithuanianLumbeeLuxembourgerMacedonianMalaysianMalteseMarshalleseMenomineeMexicanMexican American IndianMongolianMoroccanNative HawaiianNavajoNepaleseNew ZealanderNicaraguanNigerianNorthern EuropeanNorwegianOkinawanOsageOttawaPaiutePakistaniPalestinianPanamanianParaguayanPennsylvania GermanPeruvianPimaPolishPortuguesePotawatomiPuebloPuerto RicanPuget Sound SalishRomanianRussianSalvadoranSamoanScandinavianScotch-IrishScottishSeminoleSenegaleseSerbianShoshoneSierra LeoneanSiouxSlavicSlovakSloveneSomaliSouth AfricanSouth AmericanSouth American IndianSoviet UnionSpaniardSpanishSpanish AmericanSpanish American IndianSri LankanSubsaharan AfricanSudaneseSwedishSwissSyrianTaiwaneseThaiTlingit-HaidaTohono O'OdhamTonganTrinidadian and TobagonianTsimshianTurkishU.S. Virgin IslanderUgandanUkrainianUruguayanUteVenezuelanVietnameseWelshWest IndianYakamaYaquiYugoslavianYumanYup'ikZimbabwean
Immigration
NonimmigrantsImmigrantsAfghanistanAfricaAlbaniaArgentinaArmeniaAsiaAustraliaAustriaBahamasBangladeshBarbadosBelarusBelgiumBelizeBoliviaBosnia and HerzegovinaBrazilBulgariaBurma/MyanmarCabo VerdeCambodiaCameroonCanadaCaribbeanCentral AmericaChileChinaColombiaCongoCosta RicaCroatiaCubaCzechoslovakiaDenmarkDominicaDominican RepublicEastern AfricaEastern AsiaEastern EuropeEcuadorEgyptEl SalvadorEnglandEritreaEthiopiaEuropeFijiFranceGermanyGhanaGreeceGrenadaGuatemalaGuyanaHaitiHondurasHong KongHungaryIndiaIndonesiaIranIraqIrelandIsraelItalyJamaicaJapanJordanKazakhstanKenyaKoreaKuwaitLaosLatin AmericaLatviaLebanonLiberiaLithuaniaMalaysiaMexicoMicronesiaMiddle AfricaMoroccoNepalNetherlandsNicaraguaNigeriaNorth AmericaNorth MacedoniaNorthern AfricaNorthern EuropeNorwayOceaniaPakistanPanamaPeruPhilippinesPolandPortugalRomaniaRussiaSaudi ArabiaScotlandSenegalSerbiaSierra LeoneSingaporeSomaliaSouth AfricaSouth AmericaSouth Central AsiaSouth Eastern AsiaSouthern EuropeSpainSri LankaSt. Vincent and the GrenadinesSudanSwedenSwitzerlandSyriaTaiwanThailandTrinidad and TobagoTurkeyUgandaUkraineUruguayUzbekistanVenezuelaVietnamWest IndiesWestern AfricaWestern AsiaWestern EuropeYemenZaireZimbabweAzores
Immigrants from Moldova
Race
Ancestry
AfghanAfricanAlaska NativeAlaskan AthabascanAlbanianAleutAlsatianAmericanApacheArabArapahoArgentineanArmenianAssyrian/Chaldean/SyriacAustralianAustrianBahamianBangladeshiBarbadianBasqueBelgianBelizeanBermudanBhutaneseBlackfeetBolivianBrazilianBritishBritish West IndianBulgarianBurmeseCajunCambodianCanadianCape VerdeanCarpatho RusynCelticCentral AmericanCentral American IndianCherokeeCheyenneChickasawChileanChineseChippewaChoctawColombianColvilleComancheCosta RicanCreeCreekCroatianCrowCubanCypriotCzechCzechoslovakianDanishDelawareDominicanDutchDutch West IndianEastern EuropeanEcuadorianEgyptianEnglishEstonianEthiopianEuropeanFijianFilipinoFinnishFrenchFrench American IndianFrench CanadianGermanGerman RussianGhanaianGreekGuamanian/ChamorroGuatemalanGuyaneseHaitianHmongHonduranHopiHoumaHungarianIcelanderIndian (Asian)IndonesianInupiatIranianIraqiIrishIroquoisIsraeliItalianJamaicanJapaneseJordanianKenyanKiowaKoreanLaotianLatvianLebaneseLiberianLithuanianLumbeeLuxembourgerMacedonianMalaysianMalteseMarshalleseMenomineeMexicanMexican American IndianMongolianMoroccanNative HawaiianNavajoNepaleseNew ZealanderNicaraguanNigerianNorthern EuropeanNorwegianOkinawanOsageOttawaPaiutePakistaniPalestinianPanamanianParaguayanPennsylvania GermanPeruvianPimaPolishPortuguesePotawatomiPuebloPuerto RicanPuget Sound SalishRomanianRussianSalvadoranSamoanScandinavianScotch-IrishScottishSeminoleSenegaleseSerbianShoshoneSierra LeoneanSiouxSlavicSlovakSloveneSomaliSouth AfricanSouth AmericanSouth American IndianSoviet UnionSpaniardSpanishSpanish AmericanSpanish American IndianSri LankanSubsaharan AfricanSudaneseSwedishSwissSyrianTaiwaneseThaiTlingit-HaidaTohono O'OdhamTonganTrinidadian and TobagonianTsimshianTurkishU.S. Virgin IslanderUgandanUkrainianUruguayanUteVenezuelanVietnameseWelshWest IndianYakamaYaquiYugoslavianYumanYup'ikZimbabwean
Immigration
NonimmigrantsImmigrantsAfghanistanAfricaAlbaniaArgentinaArmeniaAsiaAustraliaAustriaBahamasBangladeshBarbadosBelarusBelgiumBelizeBoliviaBosnia and HerzegovinaBrazilBulgariaBurma/MyanmarCabo VerdeCambodiaCameroonCanadaCaribbeanCentral AmericaChileChinaColombiaCongoCosta RicaCroatiaCubaCzechoslovakiaDenmarkDominicaDominican RepublicEastern AfricaEastern AsiaEastern EuropeEcuadorEgyptEl SalvadorEnglandEritreaEthiopiaEuropeFijiFranceGermanyGhanaGreeceGrenadaGuatemalaGuyanaHaitiHondurasHong KongHungaryIndiaIndonesiaIranIraqIrelandIsraelItalyJamaicaJapanJordanKazakhstanKenyaKoreaKuwaitLaosLatin AmericaLatviaLebanonLiberiaLithuaniaMalaysiaMexicoMicronesiaMiddle AfricaMoldovaMoroccoNepalNetherlandsNicaraguaNigeriaNorth AmericaNorth MacedoniaNorthern AfricaNorthern EuropeNorwayOceaniaPakistanPanamaPeruPhilippinesPolandPortugalRomaniaRussiaSaudi ArabiaScotlandSenegalSerbiaSierra LeoneSingaporeSomaliaSouth AfricaSouth AmericaSouth Central AsiaSouth Eastern AsiaSouthern EuropeSpainSri LankaSt. Vincent and the GrenadinesSudanSwedenSwitzerlandSyriaTaiwanThailandTrinidad and TobagoUgandaUkraineUruguayUzbekistanVenezuelaVietnamWest IndiesWestern AfricaWestern AsiaWestern EuropeYemenZaireZimbabweAzores
Child Poverty Under the Age of 16
Income
Poverty
Unemployment
Labor Participation
Family Structure
Vehicle Availability
Education Level
Disability

Child Poverty Under the Age of 16 Comparison

Immigrants from Turkey

Immigrants from Moldova

Exceptional
Exceptional
14.4%
CHILD POVERTY UNDER THE AGE OF 16
97.6/ 100
METRIC RATING
73rd/ 347
METRIC RANK
13.8%
CHILD POVERTY UNDER THE AGE OF 16
99.3/ 100
METRIC RATING
43rd/ 347
METRIC RANK

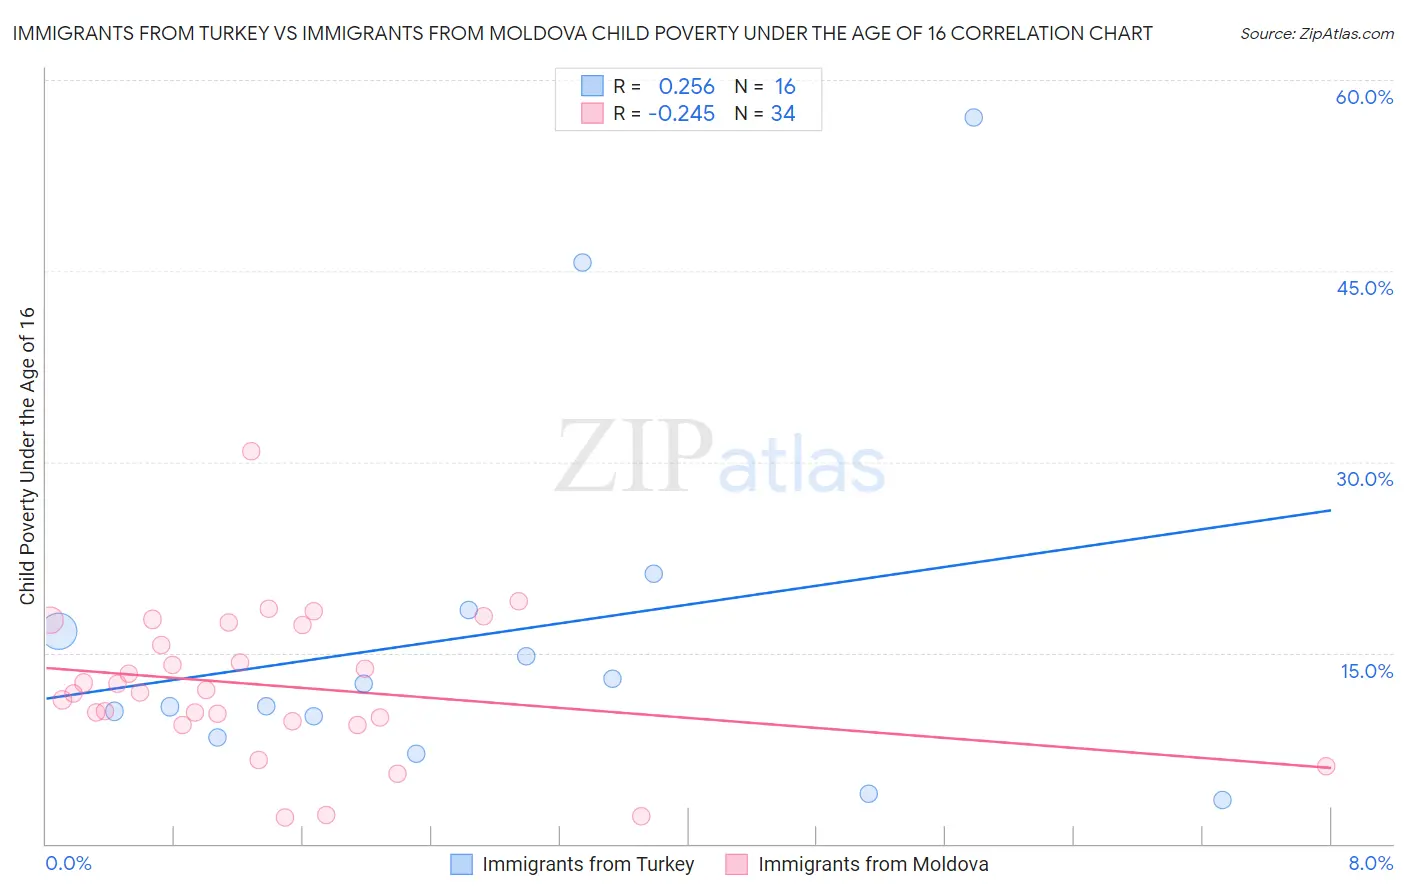
Immigrants from Turkey vs Immigrants from Moldova Child Poverty Under the Age of 16 Correlation Chart

The statistical analysis conducted on geographies consisting of 221,622,617 people shows a weak positive correlation between the proportion of Immigrants from Turkey and poverty level among children under the age of 16 in the United States with a correlation coefficient (R) of 0.256 and weighted average of 14.4%. Similarly, the statistical analysis conducted on geographies consisting of 123,967,190 people shows a weak negative correlation between the proportion of Immigrants from Moldova and poverty level among children under the age of 16 in the United States with a correlation coefficient (R) of -0.245 and weighted average of 13.8%, a difference of 4.5%.
Immigrants from Turkey vs Immigrants from Moldova Child Poverty Under the Age of 16

Child Poverty Under the Age of 16 Correlation Summary

MeasurementImmigrants from TurkeyImmigrants from Moldova
Minimum3.5%2.1%
Maximum57.0%30.9%
Range53.6%28.8%
Mean16.5%12.4%
Median11.7%12.0%
Interquartile 25% (IQ1)9.2%9.6%
Interquartile 75% (IQ3)17.6%17.2%
Interquartile Range (IQR)8.4%7.6%
Standard Deviation (Sample)14.6%5.8%
Standard Deviation (Population)14.1%5.7%

Similar Demographics by Child Poverty Under the Age of 16

Demographics Similar to Immigrants from Turkey by Child Poverty Under the Age of 16

In terms of child poverty under the age of 16, the demographic groups most similar to Immigrants from Turkey are Macedonian (14.4%, a difference of 0.0%), Cambodian (14.4%, a difference of 0.21%), Ukrainian (14.4%, a difference of 0.21%), Immigrants from Eastern Europe (14.4%, a difference of 0.21%), and Australian (14.4%, a difference of 0.25%).
DemographicsRating | RankChild Poverty Under the Age of 16
Slovenes
98.1
/100
|
#66
Exceptional
14.3%
Europeans
98.1
/100
|
#67
Exceptional
14.3%
Laotians
98.0
/100
|
#68
Exceptional
14.3%
Immigrants | Bulgaria
98.0
/100
|
#69
Exceptional
14.3%
Immigrants | Netherlands
97.9
/100
|
#70
Exceptional
14.3%
Immigrants | Poland
97.9
/100
|
#71
Exceptional
14.3%
Cambodians
97.8
/100
|
#72
Exceptional
14.4%
Immigrants | Turkey
97.6
/100
|
#73
Exceptional
14.4%
Macedonians
97.6
/100
|
#74
Exceptional
14.4%
Ukrainians
97.5
/100
|
#75
Exceptional
14.4%
Immigrants | Eastern Europe
97.5
/100
|
#76
Exceptional
14.4%
Australians
97.5
/100
|
#77
Exceptional
14.4%
Immigrants | Russia
97.3
/100
|
#78
Exceptional
14.5%
Swiss
97.3
/100
|
#79
Exceptional
14.5%
Immigrants | North Macedonia
97.2
/100
|
#80
Exceptional
14.5%

Demographics Similar to Immigrants from Moldova by Child Poverty Under the Age of 16

In terms of child poverty under the age of 16, the demographic groups most similar to Immigrants from Moldova are Immigrants from Sri Lanka (13.8%, a difference of 0.060%), Croatian (13.8%, a difference of 0.14%), Greek (13.8%, a difference of 0.17%), Czech (13.8%, a difference of 0.22%), and Immigrants from Scotland (13.7%, a difference of 0.30%).
DemographicsRating | RankChild Poverty Under the Age of 16
Immigrants | Northern Europe
99.6
/100
|
#36
Exceptional
13.6%
Immigrants | Bolivia
99.6
/100
|
#37
Exceptional
13.6%
Luxembourgers
99.5
/100
|
#38
Exceptional
13.6%
Immigrants | Australia
99.5
/100
|
#39
Exceptional
13.6%
Immigrants | Scotland
99.4
/100
|
#40
Exceptional
13.7%
Croatians
99.4
/100
|
#41
Exceptional
13.8%
Immigrants | Sri Lanka
99.3
/100
|
#42
Exceptional
13.8%
Immigrants | Moldova
99.3
/100
|
#43
Exceptional
13.8%
Greeks
99.3
/100
|
#44
Exceptional
13.8%
Czechs
99.3
/100
|
#45
Exceptional
13.8%
Immigrants | Asia
99.2
/100
|
#46
Exceptional
13.8%
Estonians
99.2
/100
|
#47
Exceptional
13.9%
Koreans
99.2
/100
|
#48
Exceptional
13.9%
Italians
99.2
/100
|
#49
Exceptional
13.9%
Immigrants | Czechoslovakia
99.1
/100
|
#50
Exceptional
13.9%