Immigrants from Trinidad and Tobago vs Sri Lankan Child Poverty Under the Age of 16

COMPARE

Immigrants from Trinidad and Tobago
Race
Ancestry
AfghanAfricanAlaska NativeAlaskan AthabascanAlbanianAleutAlsatianAmericanApacheArabArapahoArgentineanArmenianAssyrian/Chaldean/SyriacAustralianAustrianBahamianBangladeshiBarbadianBasqueBelgianBelizeanBermudanBhutaneseBlackfeetBolivianBrazilianBritishBritish West IndianBulgarianBurmeseCajunCambodianCanadianCape VerdeanCarpatho RusynCelticCentral AmericanCentral American IndianCherokeeCheyenneChickasawChileanChineseChippewaChoctawColombianColvilleComancheCosta RicanCreeCreekCroatianCrowCubanCypriotCzechCzechoslovakianDanishDelawareDominicanDutchDutch West IndianEastern EuropeanEcuadorianEgyptianEnglishEstonianEthiopianEuropeanFijianFilipinoFinnishFrenchFrench American IndianFrench CanadianGermanGerman RussianGhanaianGreekGuamanian/ChamorroGuatemalanGuyaneseHaitianHmongHonduranHopiHoumaHungarianIcelanderIndian (Asian)IndonesianInupiatIranianIraqiIrishIroquoisIsraeliItalianJamaicanJapaneseJordanianKenyanKiowaKoreanLaotianLatvianLebaneseLiberianLithuanianLumbeeLuxembourgerMacedonianMalaysianMalteseMarshalleseMenomineeMexicanMexican American IndianMongolianMoroccanNative HawaiianNavajoNepaleseNew ZealanderNicaraguanNigerianNorthern EuropeanNorwegianOkinawanOsageOttawaPaiutePakistaniPalestinianPanamanianParaguayanPennsylvania GermanPeruvianPimaPolishPortuguesePotawatomiPuebloPuerto RicanPuget Sound SalishRomanianRussianSalvadoranSamoanScandinavianScotch-IrishScottishSeminoleSenegaleseSerbianShoshoneSierra LeoneanSiouxSlavicSlovakSloveneSomaliSouth AfricanSouth AmericanSouth American IndianSoviet UnionSpaniardSpanishSpanish AmericanSpanish American IndianSubsaharan AfricanSudaneseSwedishSwissSyrianTaiwaneseThaiTlingit-HaidaTohono O'OdhamTonganTrinidadian and TobagonianTsimshianTurkishU.S. Virgin IslanderUgandanUkrainianUruguayanUteVenezuelanVietnameseWelshWest IndianYakamaYaquiYugoslavianYumanYup'ikZimbabwean
Immigration
NonimmigrantsImmigrantsAfghanistanAfricaAlbaniaArgentinaArmeniaAsiaAustraliaAustriaBahamasBangladeshBarbadosBelarusBelgiumBelizeBoliviaBosnia and HerzegovinaBrazilBulgariaBurma/MyanmarCabo VerdeCambodiaCameroonCanadaCaribbeanCentral AmericaChileChinaColombiaCongoCosta RicaCroatiaCubaCzechoslovakiaDenmarkDominicaDominican RepublicEastern AfricaEastern AsiaEastern EuropeEcuadorEgyptEl SalvadorEnglandEritreaEthiopiaEuropeFijiFranceGermanyGhanaGreeceGrenadaGuatemalaGuyanaHaitiHondurasHong KongHungaryIndiaIndonesiaIranIraqIrelandIsraelItalyJamaicaJapanJordanKazakhstanKenyaKoreaKuwaitLaosLatin AmericaLatviaLebanonLiberiaLithuaniaMalaysiaMexicoMicronesiaMiddle AfricaMoldovaMoroccoNepalNetherlandsNicaraguaNigeriaNorth AmericaNorth MacedoniaNorthern AfricaNorthern EuropeNorwayOceaniaPakistanPanamaPeruPhilippinesPolandPortugalRomaniaRussiaSaudi ArabiaScotlandSenegalSerbiaSierra LeoneSingaporeSomaliaSouth AfricaSouth AmericaSouth Central AsiaSouth Eastern AsiaSouthern EuropeSpainSri LankaSt. Vincent and the GrenadinesSudanSwedenSwitzerlandSyriaTaiwanThailandTrinidad and TobagoTurkeyUgandaUkraineUruguayUzbekistanVenezuelaVietnamWest IndiesWestern AfricaWestern AsiaWestern EuropeYemenZaireZimbabweAzores
Sri Lankan
Race
Ancestry
AfghanAfricanAlaska NativeAlaskan AthabascanAlbanianAleutAlsatianAmericanApacheArabArapahoArgentineanArmenianAssyrian/Chaldean/SyriacAustralianAustrianBahamianBangladeshiBarbadianBasqueBelgianBelizeanBermudanBhutaneseBlackfeetBolivianBrazilianBritishBritish West IndianBulgarianBurmeseCajunCambodianCanadianCape VerdeanCarpatho RusynCelticCentral AmericanCentral American IndianCherokeeCheyenneChickasawChileanChineseChippewaChoctawColombianColvilleComancheCosta RicanCreeCreekCroatianCrowCubanCypriotCzechCzechoslovakianDanishDelawareDominicanDutchDutch West IndianEastern EuropeanEcuadorianEgyptianEnglishEstonianEthiopianEuropeanFijianFilipinoFinnishFrenchFrench American IndianFrench CanadianGermanGerman RussianGhanaianGreekGuamanian/ChamorroGuatemalanGuyaneseHaitianHmongHonduranHopiHoumaHungarianIcelanderIndian (Asian)IndonesianInupiatIranianIraqiIrishIroquoisIsraeliItalianJamaicanJapaneseJordanianKenyanKiowaKoreanLaotianLatvianLebaneseLiberianLithuanianLumbeeLuxembourgerMacedonianMalaysianMalteseMarshalleseMenomineeMexicanMexican American IndianMongolianMoroccanNative HawaiianNavajoNepaleseNew ZealanderNicaraguanNigerianNorthern EuropeanNorwegianOkinawanOsageOttawaPaiutePakistaniPalestinianPanamanianParaguayanPennsylvania GermanPeruvianPimaPolishPortuguesePotawatomiPuebloPuerto RicanPuget Sound SalishRomanianRussianSalvadoranSamoanScandinavianScotch-IrishScottishSeminoleSenegaleseSerbianShoshoneSierra LeoneanSiouxSlavicSlovakSloveneSomaliSouth AfricanSouth AmericanSouth American IndianSoviet UnionSpaniardSpanishSpanish AmericanSpanish American IndianSri LankanSubsaharan AfricanSudaneseSwedishSwissSyrianTaiwaneseThaiTlingit-HaidaTohono O'OdhamTonganTrinidadian and TobagonianTsimshianTurkishU.S. Virgin IslanderUgandanUkrainianUruguayanUteVenezuelanVietnameseWelshWest IndianYakamaYaquiYugoslavianYumanYup'ikZimbabwean
Immigration
NonimmigrantsImmigrantsAfghanistanAfricaAlbaniaArgentinaArmeniaAsiaAustraliaAustriaBahamasBangladeshBarbadosBelarusBelgiumBelizeBoliviaBosnia and HerzegovinaBrazilBulgariaBurma/MyanmarCabo VerdeCambodiaCameroonCanadaCaribbeanCentral AmericaChileChinaColombiaCongoCosta RicaCroatiaCubaCzechoslovakiaDenmarkDominicaDominican RepublicEastern AfricaEastern AsiaEastern EuropeEcuadorEgyptEl SalvadorEnglandEritreaEthiopiaEuropeFijiFranceGermanyGhanaGreeceGrenadaGuatemalaGuyanaHaitiHondurasHong KongHungaryIndiaIndonesiaIranIraqIrelandIsraelItalyJamaicaJapanJordanKazakhstanKenyaKoreaKuwaitLaosLatin AmericaLatviaLebanonLiberiaLithuaniaMalaysiaMexicoMicronesiaMiddle AfricaMoldovaMoroccoNepalNetherlandsNicaraguaNigeriaNorth AmericaNorth MacedoniaNorthern AfricaNorthern EuropeNorwayOceaniaPakistanPanamaPeruPhilippinesPolandPortugalRomaniaRussiaSaudi ArabiaScotlandSenegalSerbiaSierra LeoneSingaporeSomaliaSouth AfricaSouth AmericaSouth Central AsiaSouth Eastern AsiaSouthern EuropeSpainSri LankaSt. Vincent and the GrenadinesSudanSwedenSwitzerlandSyriaTaiwanThailandTurkeyUgandaUkraineUruguayUzbekistanVenezuelaVietnamWest IndiesWestern AfricaWestern AsiaWestern EuropeYemenZaireZimbabweAzores
Child Poverty Under the Age of 16
Income
Poverty
Unemployment
Labor Participation
Family Structure
Vehicle Availability
Education Level
Disability

Child Poverty Under the Age of 16 Comparison

Immigrants from Trinidad and Tobago

Sri Lankans

Tragic
Exceptional
19.1%
CHILD POVERTY UNDER THE AGE OF 16
0.3/ 100
METRIC RATING
252nd/ 347
METRIC RANK
14.9%
CHILD POVERTY UNDER THE AGE OF 16
93.2/ 100
METRIC RATING
114th/ 347
METRIC RANK

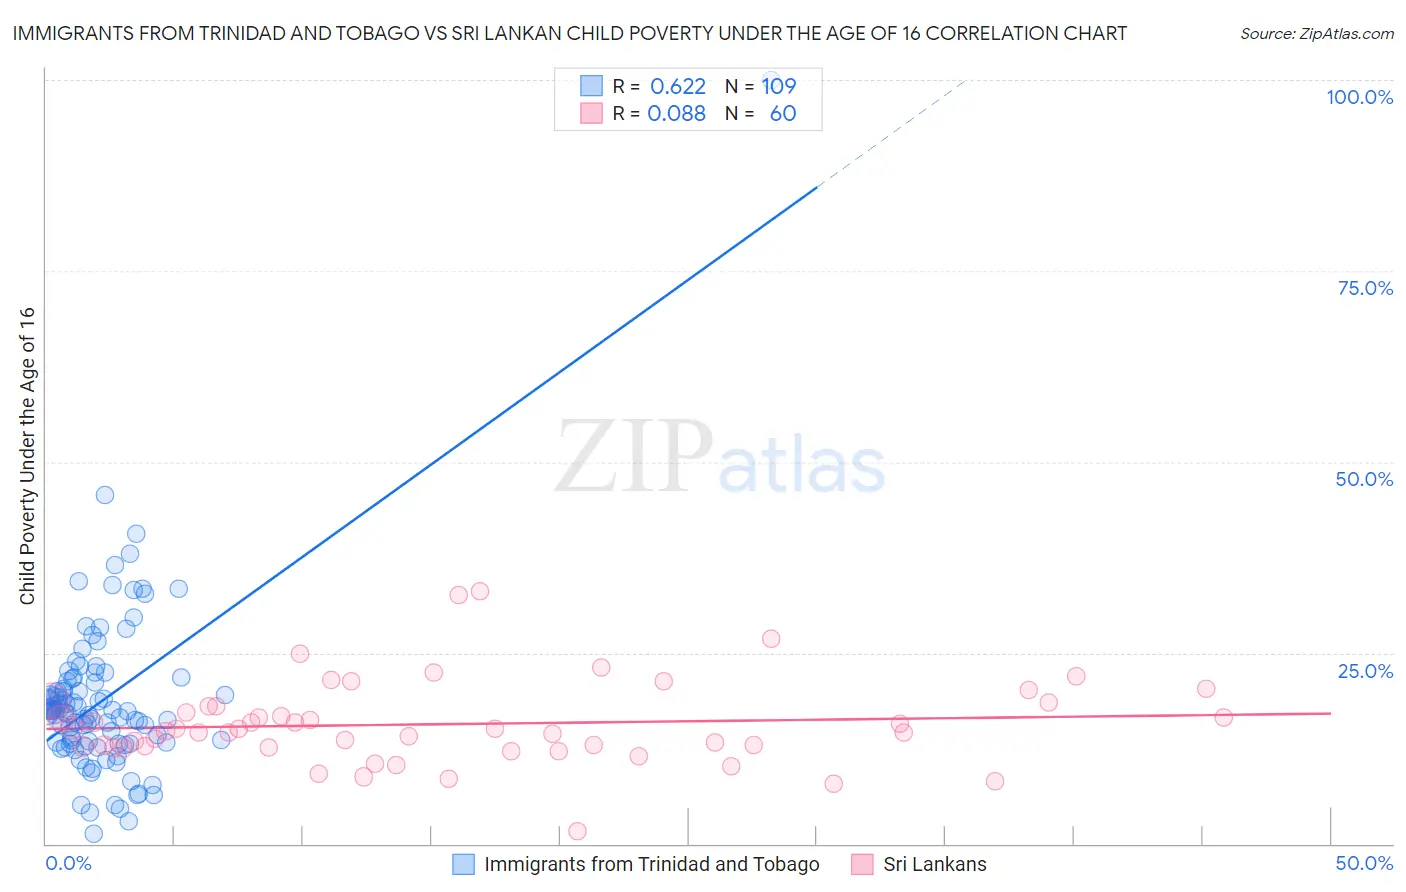
Immigrants from Trinidad and Tobago vs Sri Lankan Child Poverty Under the Age of 16 Correlation Chart

The statistical analysis conducted on geographies consisting of 222,555,778 people shows a significant positive correlation between the proportion of Immigrants from Trinidad and Tobago and poverty level among children under the age of 16 in the United States with a correlation coefficient (R) of 0.622 and weighted average of 19.1%. Similarly, the statistical analysis conducted on geographies consisting of 436,349,491 people shows a slight positive correlation between the proportion of Sri Lankans and poverty level among children under the age of 16 in the United States with a correlation coefficient (R) of 0.088 and weighted average of 14.9%, a difference of 27.8%.
Immigrants from Trinidad and Tobago vs Sri Lankan Child Poverty Under the Age of 16

Child Poverty Under the Age of 16 Correlation Summary

MeasurementImmigrants from Trinidad and TobagoSri Lankan
Minimum1.3%1.7%
Maximum100.0%33.1%
Range98.7%31.4%
Mean18.8%15.7%
Median17.4%14.9%
Interquartile 25% (IQ1)13.2%12.7%
Interquartile 75% (IQ3)21.5%18.0%
Interquartile Range (IQR)8.3%5.3%
Standard Deviation (Sample)11.3%5.5%
Standard Deviation (Population)11.2%5.5%

Similar Demographics by Child Poverty Under the Age of 16

Demographics Similar to Immigrants from Trinidad and Tobago by Child Poverty Under the Age of 16

In terms of child poverty under the age of 16, the demographic groups most similar to Immigrants from Trinidad and Tobago are Immigrants from Ghana (19.1%, a difference of 0.070%), Salvadoran (19.1%, a difference of 0.19%), Immigrants from Middle Africa (19.0%, a difference of 0.23%), Potawatomi (19.0%, a difference of 0.43%), and Immigrants from Western Africa (19.2%, a difference of 0.44%).
DemographicsRating | RankChild Poverty Under the Age of 16
Shoshone
0.5
/100
|
#245
Tragic
18.8%
Immigrants | Nicaragua
0.4
/100
|
#246
Tragic
18.8%
French American Indians
0.4
/100
|
#247
Tragic
18.9%
Ecuadorians
0.3
/100
|
#248
Tragic
19.0%
Potawatomi
0.3
/100
|
#249
Tragic
19.0%
Immigrants | Middle Africa
0.3
/100
|
#250
Tragic
19.0%
Immigrants | Ghana
0.3
/100
|
#251
Tragic
19.1%
Immigrants | Trinidad and Tobago
0.3
/100
|
#252
Tragic
19.1%
Salvadorans
0.3
/100
|
#253
Tragic
19.1%
Immigrants | Western Africa
0.2
/100
|
#254
Tragic
19.2%
Trinidadians and Tobagonians
0.2
/100
|
#255
Tragic
19.2%
Inupiat
0.2
/100
|
#256
Tragic
19.2%
Ottawa
0.2
/100
|
#257
Tragic
19.2%
Spanish Americans
0.2
/100
|
#258
Tragic
19.2%
Mexican American Indians
0.2
/100
|
#259
Tragic
19.3%

Demographics Similar to Sri Lankans by Child Poverty Under the Age of 16

In terms of child poverty under the age of 16, the demographic groups most similar to Sri Lankans are Belgian (14.9%, a difference of 0.030%), Immigrants from Ukraine (14.9%, a difference of 0.060%), Irish (14.9%, a difference of 0.070%), Carpatho Rusyn (14.9%, a difference of 0.080%), and Immigrants from Denmark (14.9%, a difference of 0.13%).
DemographicsRating | RankChild Poverty Under the Age of 16
Chileans
94.4
/100
|
#107
Exceptional
14.8%
Jordanians
94.2
/100
|
#108
Exceptional
14.8%
Tlingit-Haida
94.1
/100
|
#109
Exceptional
14.9%
English
93.5
/100
|
#110
Exceptional
14.9%
Immigrants | Denmark
93.5
/100
|
#111
Exceptional
14.9%
Irish
93.4
/100
|
#112
Exceptional
14.9%
Belgians
93.3
/100
|
#113
Exceptional
14.9%
Sri Lankans
93.2
/100
|
#114
Exceptional
14.9%
Immigrants | Ukraine
93.1
/100
|
#115
Exceptional
14.9%
Carpatho Rusyns
93.1
/100
|
#116
Exceptional
14.9%
Immigrants | Norway
92.8
/100
|
#117
Exceptional
15.0%
Immigrants | Malaysia
92.6
/100
|
#118
Exceptional
15.0%
Scottish
92.3
/100
|
#119
Exceptional
15.0%
South Africans
92.1
/100
|
#120
Exceptional
15.0%
Immigrants | Zimbabwe
92.1
/100
|
#121
Exceptional
15.0%