Immigrants from Trinidad and Tobago vs Nonimmigrants Child Poverty Among Boys Under 16

COMPARE

Immigrants from Trinidad and Tobago
Race
Ancestry
AfghanAfricanAlaska NativeAlaskan AthabascanAlbanianAleutAlsatianAmericanApacheArabArapahoArgentineanArmenianAssyrian/Chaldean/SyriacAustralianAustrianBahamianBangladeshiBarbadianBasqueBelgianBelizeanBermudanBhutaneseBlackfeetBolivianBrazilianBritishBritish West IndianBulgarianBurmeseCajunCambodianCanadianCape VerdeanCarpatho RusynCelticCentral AmericanCentral American IndianCherokeeCheyenneChickasawChileanChineseChippewaChoctawColombianColvilleComancheCosta RicanCreeCreekCroatianCrowCubanCypriotCzechCzechoslovakianDanishDelawareDominicanDutchDutch West IndianEastern EuropeanEcuadorianEgyptianEnglishEstonianEthiopianEuropeanFijianFilipinoFinnishFrenchFrench American IndianFrench CanadianGermanGerman RussianGhanaianGreekGuamanian/ChamorroGuatemalanGuyaneseHaitianHmongHonduranHopiHoumaHungarianIcelanderIndian (Asian)IndonesianInupiatIranianIraqiIrishIroquoisIsraeliItalianJamaicanJapaneseJordanianKenyanKiowaKoreanLaotianLatvianLebaneseLiberianLithuanianLumbeeLuxembourgerMacedonianMalaysianMalteseMarshalleseMenomineeMexicanMexican American IndianMongolianMoroccanNative HawaiianNavajoNepaleseNew ZealanderNicaraguanNigerianNorthern EuropeanNorwegianOkinawanOsageOttawaPaiutePakistaniPalestinianPanamanianParaguayanPennsylvania GermanPeruvianPimaPolishPortuguesePotawatomiPuebloPuerto RicanPuget Sound SalishRomanianRussianSalvadoranSamoanScandinavianScotch-IrishScottishSeminoleSenegaleseSerbianShoshoneSierra LeoneanSiouxSlavicSlovakSloveneSomaliSouth AfricanSouth AmericanSouth American IndianSoviet UnionSpaniardSpanishSpanish AmericanSpanish American IndianSri LankanSubsaharan AfricanSudaneseSwedishSwissSyrianTaiwaneseThaiTlingit-HaidaTohono O'OdhamTonganTrinidadian and TobagonianTsimshianTurkishU.S. Virgin IslanderUgandanUkrainianUruguayanUteVenezuelanVietnameseWelshWest IndianYakamaYaquiYugoslavianYumanYup'ikZimbabwean
Immigration
ImmigrantsAfghanistanAfricaAlbaniaArgentinaArmeniaAsiaAustraliaAustriaBahamasBangladeshBarbadosBelarusBelgiumBelizeBoliviaBosnia and HerzegovinaBrazilBulgariaBurma/MyanmarCabo VerdeCambodiaCameroonCanadaCaribbeanCentral AmericaChileChinaColombiaCongoCosta RicaCroatiaCubaCzechoslovakiaDenmarkDominicaDominican RepublicEastern AfricaEastern AsiaEastern EuropeEcuadorEgyptEl SalvadorEnglandEritreaEthiopiaEuropeFijiFranceGermanyGhanaGreeceGrenadaGuatemalaGuyanaHaitiHondurasHong KongHungaryIndiaIndonesiaIranIraqIrelandIsraelItalyJamaicaJapanJordanKazakhstanKenyaKoreaKuwaitLaosLatin AmericaLatviaLebanonLiberiaLithuaniaMalaysiaMexicoMicronesiaMiddle AfricaMoldovaMoroccoNepalNetherlandsNicaraguaNigeriaNorth AmericaNorth MacedoniaNorthern AfricaNorthern EuropeNorwayOceaniaPakistanPanamaPeruPhilippinesPolandPortugalRomaniaRussiaSaudi ArabiaScotlandSenegalSerbiaSierra LeoneSingaporeSomaliaSouth AfricaSouth AmericaSouth Central AsiaSouth Eastern AsiaSouthern EuropeSpainSri LankaSt. Vincent and the GrenadinesSudanSwedenSwitzerlandSyriaTaiwanThailandTrinidad and TobagoTurkeyUgandaUkraineUruguayUzbekistanVenezuelaVietnamWest IndiesWestern AfricaWestern AsiaWestern EuropeYemenZaireZimbabweAzores
Nonimmigrants
Race
Ancestry
AfghanAfricanAlaska NativeAlaskan AthabascanAlbanianAleutAlsatianAmericanApacheArabArapahoArgentineanArmenianAssyrian/Chaldean/SyriacAustralianAustrianBahamianBangladeshiBarbadianBasqueBelgianBelizeanBermudanBhutaneseBlackfeetBolivianBrazilianBritishBritish West IndianBulgarianBurmeseCajunCambodianCanadianCape VerdeanCarpatho RusynCelticCentral AmericanCentral American IndianCherokeeCheyenneChickasawChileanChineseChippewaChoctawColombianColvilleComancheCosta RicanCreeCreekCroatianCrowCubanCypriotCzechCzechoslovakianDanishDelawareDominicanDutchDutch West IndianEastern EuropeanEcuadorianEgyptianEnglishEstonianEthiopianEuropeanFijianFilipinoFinnishFrenchFrench American IndianFrench CanadianGermanGerman RussianGhanaianGreekGuamanian/ChamorroGuatemalanGuyaneseHaitianHmongHonduranHopiHoumaHungarianIcelanderIndian (Asian)IndonesianInupiatIranianIraqiIrishIroquoisIsraeliItalianJamaicanJapaneseJordanianKenyanKiowaKoreanLaotianLatvianLebaneseLiberianLithuanianLumbeeLuxembourgerMacedonianMalaysianMalteseMarshalleseMenomineeMexicanMexican American IndianMongolianMoroccanNative HawaiianNavajoNepaleseNew ZealanderNicaraguanNigerianNorthern EuropeanNorwegianOkinawanOsageOttawaPaiutePakistaniPalestinianPanamanianParaguayanPennsylvania GermanPeruvianPimaPolishPortuguesePotawatomiPuebloPuerto RicanPuget Sound SalishRomanianRussianSalvadoranSamoanScandinavianScotch-IrishScottishSeminoleSenegaleseSerbianShoshoneSierra LeoneanSiouxSlavicSlovakSloveneSomaliSouth AfricanSouth AmericanSouth American IndianSoviet UnionSpaniardSpanishSpanish AmericanSpanish American IndianSri LankanSubsaharan AfricanSudaneseSwedishSwissSyrianTaiwaneseThaiTlingit-HaidaTohono O'OdhamTonganTrinidadian and TobagonianTsimshianTurkishU.S. Virgin IslanderUgandanUkrainianUruguayanUteVenezuelanVietnameseWelshWest IndianYakamaYaquiYugoslavianYumanYup'ikZimbabwean
Immigration
NonimmigrantsImmigrantsAfghanistanAfricaAlbaniaArgentinaArmeniaAsiaAustraliaAustriaBahamasBangladeshBarbadosBelarusBelgiumBelizeBoliviaBosnia and HerzegovinaBrazilBulgariaBurma/MyanmarCabo VerdeCambodiaCameroonCanadaCaribbeanCentral AmericaChileChinaColombiaCongoCosta RicaCroatiaCubaCzechoslovakiaDenmarkDominicaDominican RepublicEastern AfricaEastern AsiaEastern EuropeEcuadorEgyptEl SalvadorEnglandEritreaEthiopiaEuropeFijiFranceGermanyGhanaGreeceGrenadaGuatemalaGuyanaHaitiHondurasHong KongHungaryIndiaIndonesiaIranIraqIrelandIsraelItalyJamaicaJapanJordanKazakhstanKenyaKoreaKuwaitLaosLatin AmericaLatviaLebanonLiberiaLithuaniaMalaysiaMexicoMicronesiaMiddle AfricaMoldovaMoroccoNepalNetherlandsNicaraguaNigeriaNorth AmericaNorth MacedoniaNorthern AfricaNorthern EuropeNorwayOceaniaPakistanPanamaPeruPhilippinesPolandPortugalRomaniaRussiaSaudi ArabiaScotlandSenegalSerbiaSierra LeoneSingaporeSomaliaSouth AfricaSouth AmericaSouth Central AsiaSouth Eastern AsiaSouthern EuropeSpainSri LankaSt. Vincent and the GrenadinesSudanSwedenSwitzerlandSyriaTaiwanThailandTurkeyUgandaUkraineUruguayUzbekistanVenezuelaVietnamWest IndiesWestern AfricaWestern AsiaWestern EuropeYemenZaireZimbabweAzores
Child Poverty Among Boys Under 16
Income
Poverty
Unemployment
Labor Participation
Family Structure
Vehicle Availability
Education Level
Disability

Child Poverty Among Boys Under 16 Comparison

Immigrants from Trinidad and Tobago

Nonimmigrants

Tragic
Tragic
19.0%
CHILD POVERTY AMONG BOYS UNDER 16
0.3/ 100
METRIC RATING
247th/ 347
METRIC RANK
18.2%
CHILD POVERTY AMONG BOYS UNDER 16
2.2/ 100
METRIC RATING
228th/ 347
METRIC RANK

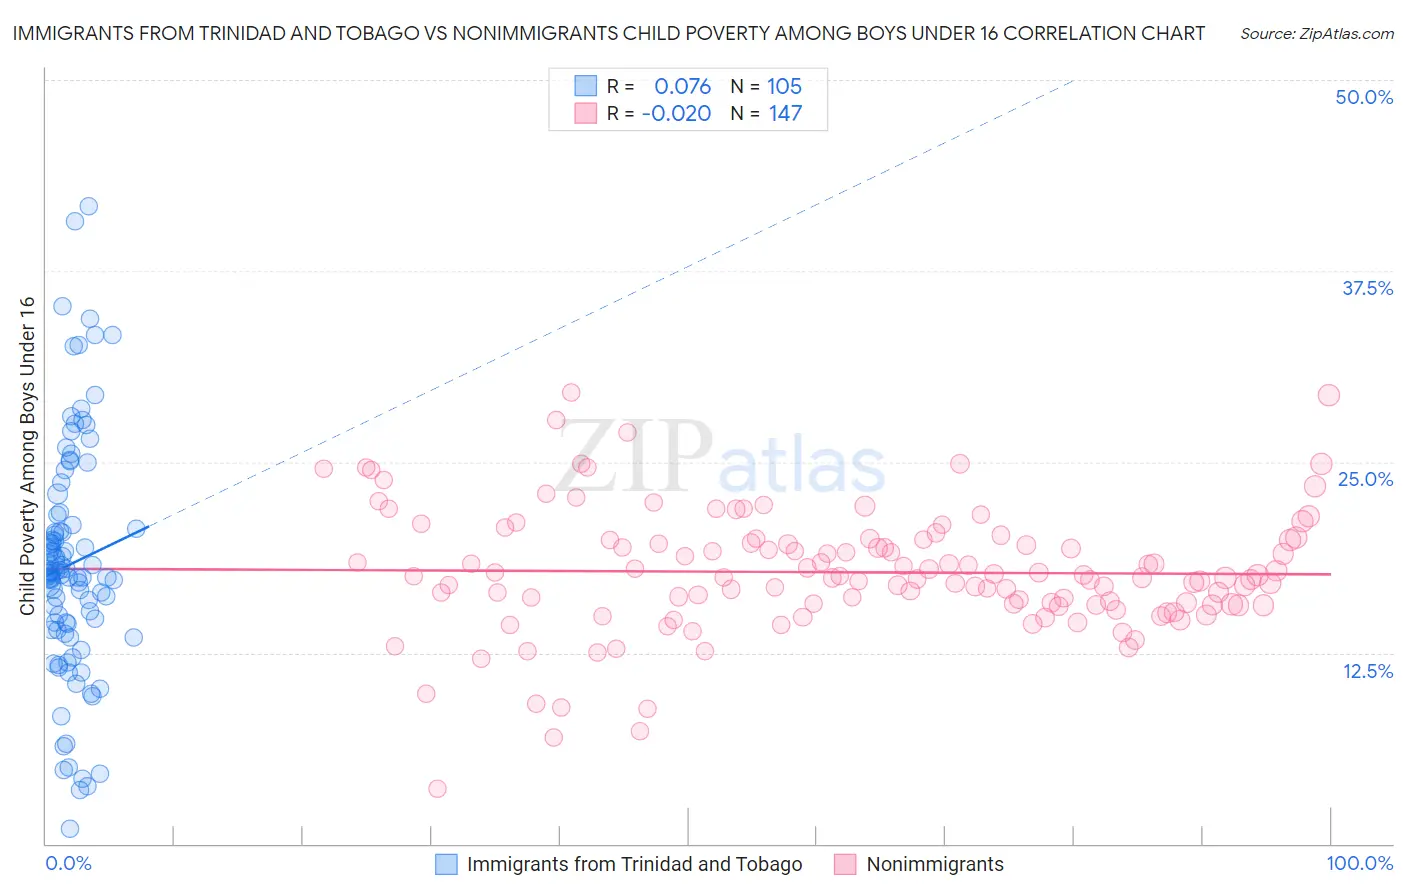
Immigrants from Trinidad and Tobago vs Nonimmigrants Child Poverty Among Boys Under 16 Correlation Chart

The statistical analysis conducted on geographies consisting of 221,543,811 people shows a slight positive correlation between the proportion of Immigrants from Trinidad and Tobago and poverty level among boys under the age of 16 in the United States with a correlation coefficient (R) of 0.076 and weighted average of 19.0%. Similarly, the statistical analysis conducted on geographies consisting of 561,195,614 people shows no correlation between the proportion of Nonimmigrants and poverty level among boys under the age of 16 in the United States with a correlation coefficient (R) of -0.020 and weighted average of 18.2%, a difference of 4.7%.
Immigrants from Trinidad and Tobago vs Nonimmigrants Child Poverty Among Boys Under 16

Child Poverty Among Boys Under 16 Correlation Summary

MeasurementImmigrants from Trinidad and TobagoNonimmigrants
Minimum0.94%3.6%
Maximum41.7%29.6%
Range40.8%26.0%
Mean18.3%17.8%
Median17.7%17.4%
Interquartile 25% (IQ1)14.0%15.7%
Interquartile 75% (IQ3)21.2%19.9%
Interquartile Range (IQR)7.2%4.2%
Standard Deviation (Sample)7.8%4.1%
Standard Deviation (Population)7.7%4.0%

Demographics Similar to Immigrants from Trinidad and Tobago and Nonimmigrants by Child Poverty Among Boys Under 16

In terms of child poverty among boys under 16, the demographic groups most similar to Immigrants from Trinidad and Tobago are Immigrants from Nicaragua (19.0%, a difference of 0.12%), Cree (19.0%, a difference of 0.32%), Immigrants from Middle Africa (18.9%, a difference of 0.45%), Immigrants from the Azores (18.9%, a difference of 0.46%), and Ghanaian (18.9%, a difference of 0.80%). Similarly, the demographic groups most similar to Nonimmigrants are Bermudan (18.1%, a difference of 0.33%), Immigrants from Micronesia (18.3%, a difference of 0.52%), Fijian (18.3%, a difference of 0.52%), Nicaraguan (18.4%, a difference of 1.1%), and Marshallese (18.4%, a difference of 1.3%).
DemographicsRating | RankChild Poverty Among Boys Under 16
Bermudans
2.5
/100
|
#227
Tragic
18.1%
Immigrants | Nonimmigrants
2.2
/100
|
#228
Tragic
18.2%
Immigrants | Micronesia
1.8
/100
|
#229
Tragic
18.3%
Fijians
1.8
/100
|
#230
Tragic
18.3%
Nicaraguans
1.4
/100
|
#231
Tragic
18.4%
Marshallese
1.3
/100
|
#232
Tragic
18.4%
Immigrants | Nigeria
1.2
/100
|
#233
Tragic
18.4%
Nigerians
1.1
/100
|
#234
Tragic
18.5%
Americans
0.9
/100
|
#235
Tragic
18.6%
Sudanese
0.9
/100
|
#236
Tragic
18.6%
Immigrants | Eritrea
0.8
/100
|
#237
Tragic
18.6%
Immigrants | Laos
0.8
/100
|
#238
Tragic
18.7%
Cape Verdeans
0.7
/100
|
#239
Tragic
18.7%
Immigrants | Cuba
0.6
/100
|
#240
Tragic
18.8%
Immigrants | Sudan
0.6
/100
|
#241
Tragic
18.8%
Ghanaians
0.5
/100
|
#242
Tragic
18.9%
Immigrants | Azores
0.4
/100
|
#243
Tragic
18.9%
Immigrants | Middle Africa
0.4
/100
|
#244
Tragic
18.9%
Cree
0.4
/100
|
#245
Tragic
19.0%
Immigrants | Nicaragua
0.4
/100
|
#246
Tragic
19.0%
Immigrants | Trinidad and Tobago
0.3
/100
|
#247
Tragic
19.0%