Immigrants from Thailand vs Pakistani Female Poverty
COMPARE
Immigrants from Thailand
Pakistani
Female Poverty
Female Poverty Comparison
Immigrants from Thailand
Pakistanis
14.4%
FEMALE POVERTY
4.5/ 100
METRIC RATING
216th/ 347
METRIC RANK
12.9%
FEMALE POVERTY
83.0/ 100
METRIC RATING
140th/ 347
METRIC RANK
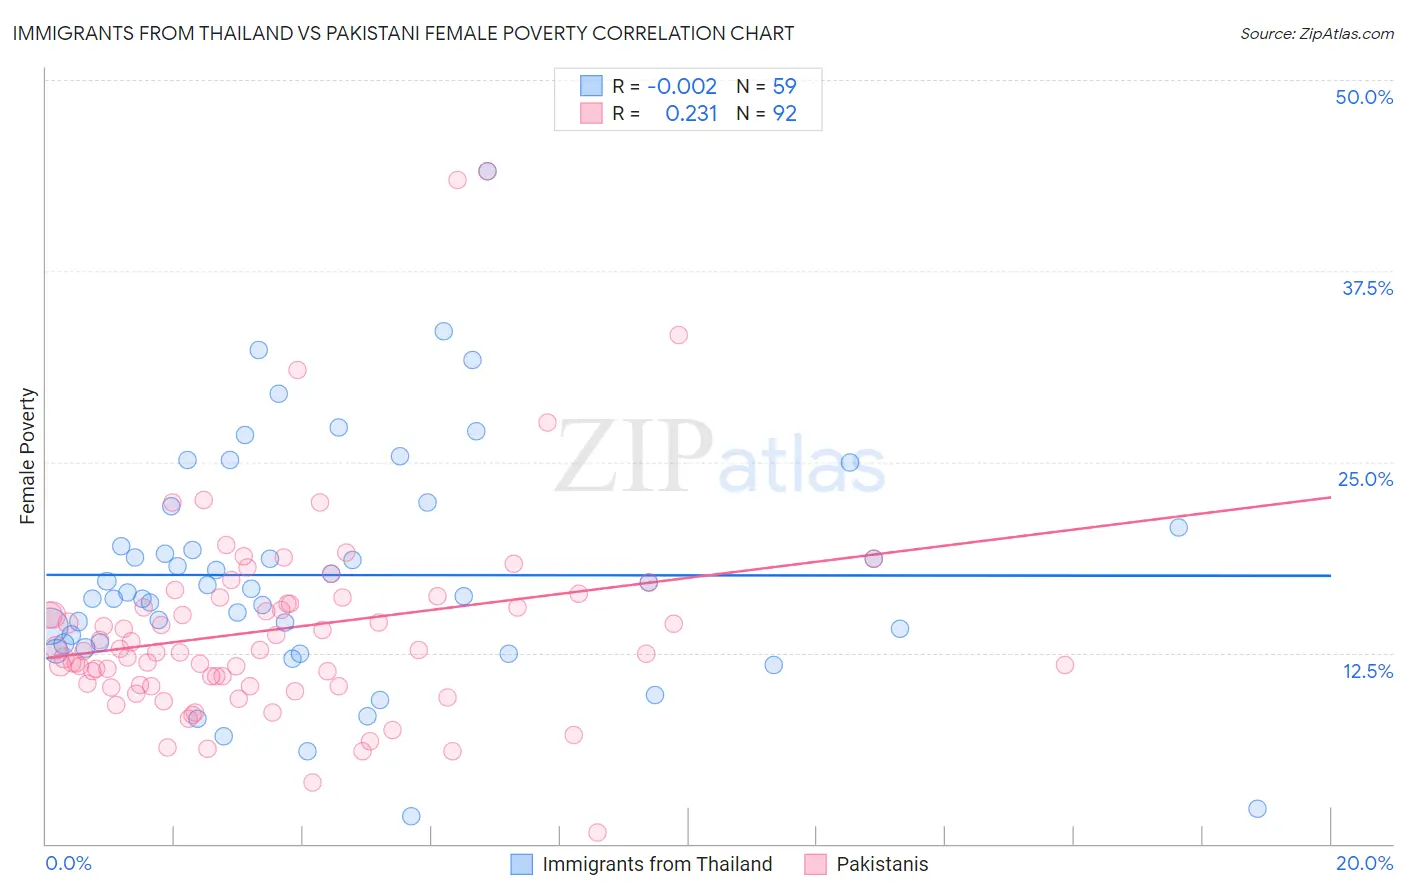
Immigrants from Thailand vs Pakistani Female Poverty Correlation Chart
The statistical analysis conducted on geographies consisting of 316,905,343 people shows no correlation between the proportion of Immigrants from Thailand and poverty level among females in the United States with a correlation coefficient (R) of -0.002 and weighted average of 14.4%. Similarly, the statistical analysis conducted on geographies consisting of 335,177,271 people shows a weak positive correlation between the proportion of Pakistanis and poverty level among females in the United States with a correlation coefficient (R) of 0.231 and weighted average of 12.9%, a difference of 11.6%.
Female Poverty Correlation Summary
| Measurement | Immigrants from Thailand | Pakistani |
| Minimum | 1.8% | 0.74% |
| Maximum | 44.1% | 44.1% |
| Range | 42.3% | 43.3% |
| Mean | 17.6% | 14.0% |
| Median | 16.4% | 12.7% |
| Interquartile 25% (IQ1) | 13.1% | 10.3% |
| Interquartile 75% (IQ3) | 20.7% | 15.9% |
| Interquartile Range (IQR) | 7.6% | 5.6% |
| Standard Deviation (Sample) | 7.7% | 6.8% |
| Standard Deviation (Population) | 7.6% | 6.7% |
Similar Demographics by Female Poverty
Demographics Similar to Immigrants from Thailand by Female Poverty
In terms of female poverty, the demographic groups most similar to Immigrants from Thailand are Immigrants (14.4%, a difference of 0.030%), Immigrants from Uzbekistan (14.4%, a difference of 0.080%), Immigrants from Panama (14.4%, a difference of 0.090%), Japanese (14.5%, a difference of 0.22%), and Marshallese (14.4%, a difference of 0.23%).
| Demographics | Rating | Rank | Female Poverty |
| Panamanians | 7.7 /100 | #209 | Tragic 14.2% |
| Malaysians | 7.4 /100 | #210 | Tragic 14.3% |
| Moroccans | 7.2 /100 | #211 | Tragic 14.3% |
| Bermudans | 5.5 /100 | #212 | Tragic 14.4% |
| Alaskan Athabascans | 5.3 /100 | #213 | Tragic 14.4% |
| Marshallese | 5.0 /100 | #214 | Tragic 14.4% |
| Immigrants | Panama | 4.7 /100 | #215 | Tragic 14.4% |
| Immigrants | Thailand | 4.5 /100 | #216 | Tragic 14.4% |
| Immigrants | Immigrants | 4.5 /100 | #217 | Tragic 14.4% |
| Immigrants | Uzbekistan | 4.4 /100 | #218 | Tragic 14.4% |
| Japanese | 4.1 /100 | #219 | Tragic 14.5% |
| Alsatians | 4.0 /100 | #220 | Tragic 14.5% |
| Immigrants | Cambodia | 3.7 /100 | #221 | Tragic 14.5% |
| Immigrants | Nonimmigrants | 3.7 /100 | #222 | Tragic 14.5% |
| Immigrants | Africa | 3.3 /100 | #223 | Tragic 14.5% |
Demographics Similar to Pakistanis by Female Poverty
In terms of female poverty, the demographic groups most similar to Pakistanis are Basque (12.9%, a difference of 0.010%), Immigrants from France (12.9%, a difference of 0.10%), Chilean (12.9%, a difference of 0.32%), Icelander (13.0%, a difference of 0.32%), and Peruvian (12.9%, a difference of 0.41%).
| Demographics | Rating | Rank | Female Poverty |
| Immigrants | Western Europe | 86.6 /100 | #133 | Excellent 12.8% |
| Immigrants | Switzerland | 85.8 /100 | #134 | Excellent 12.9% |
| French | 85.6 /100 | #135 | Excellent 12.9% |
| Peruvians | 85.2 /100 | #136 | Excellent 12.9% |
| Chileans | 84.7 /100 | #137 | Excellent 12.9% |
| Immigrants | France | 83.6 /100 | #138 | Excellent 12.9% |
| Basques | 83.1 /100 | #139 | Excellent 12.9% |
| Pakistanis | 83.0 /100 | #140 | Excellent 12.9% |
| Icelanders | 81.1 /100 | #141 | Excellent 13.0% |
| Brazilians | 80.5 /100 | #142 | Excellent 13.0% |
| Immigrants | Malaysia | 80.4 /100 | #143 | Excellent 13.0% |
| Afghans | 79.8 /100 | #144 | Good 13.0% |
| Syrians | 79.6 /100 | #145 | Good 13.0% |
| Immigrants | Peru | 79.1 /100 | #146 | Good 13.0% |
| Immigrants | Kazakhstan | 78.6 /100 | #147 | Good 13.0% |