Immigrants from Taiwan vs Pennsylvania German Single Female Poverty
COMPARE
Immigrants from Taiwan
Pennsylvania German
Single Female Poverty
Single Female Poverty Comparison
Immigrants from Taiwan
Pennsylvania Germans
16.4%
SINGLE FEMALE POVERTY
100.0/ 100
METRIC RATING
2nd/ 347
METRIC RANK
23.6%
SINGLE FEMALE POVERTY
0.0/ 100
METRIC RATING
277th/ 347
METRIC RANK
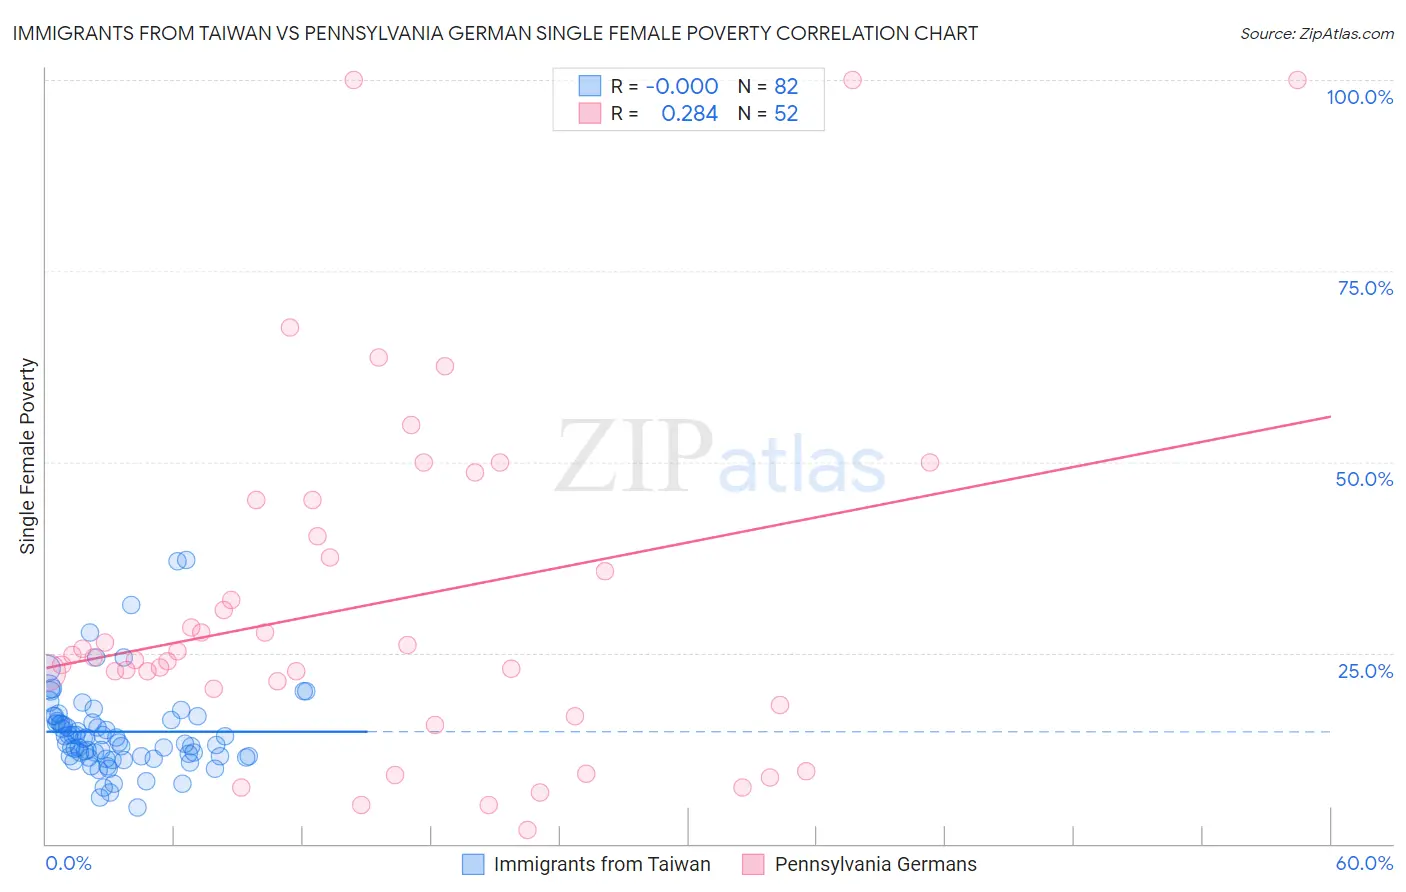
Immigrants from Taiwan vs Pennsylvania German Single Female Poverty Correlation Chart
The statistical analysis conducted on geographies consisting of 293,913,772 people shows no correlation between the proportion of Immigrants from Taiwan and poverty level among single females in the United States with a correlation coefficient (R) of -0.000 and weighted average of 16.4%. Similarly, the statistical analysis conducted on geographies consisting of 231,066,228 people shows a weak positive correlation between the proportion of Pennsylvania Germans and poverty level among single females in the United States with a correlation coefficient (R) of 0.284 and weighted average of 23.6%, a difference of 44.2%.
Single Female Poverty Correlation Summary
| Measurement | Immigrants from Taiwan | Pennsylvania German |
| Minimum | 4.7% | 1.8% |
| Maximum | 37.2% | 100.0% |
| Range | 32.5% | 98.2% |
| Mean | 14.7% | 31.6% |
| Median | 13.5% | 24.5% |
| Interquartile 25% (IQ1) | 11.4% | 19.2% |
| Interquartile 75% (IQ3) | 16.2% | 42.6% |
| Interquartile Range (IQR) | 4.8% | 23.4% |
| Standard Deviation (Sample) | 5.8% | 23.3% |
| Standard Deviation (Population) | 5.8% | 23.1% |
Similar Demographics by Single Female Poverty
Demographics Similar to Immigrants from Taiwan by Single Female Poverty
In terms of single female poverty, the demographic groups most similar to Immigrants from Taiwan are Immigrants from Hong Kong (16.5%, a difference of 1.1%), Chinese (16.1%, a difference of 1.3%), Immigrants from India (16.8%, a difference of 2.8%), Assyrian/Chaldean/Syriac (17.0%, a difference of 3.7%), and Filipino (17.0%, a difference of 3.9%).
| Demographics | Rating | Rank | Single Female Poverty |
| Chinese | 100.0 /100 | #1 | Exceptional 16.1% |
| Immigrants | Taiwan | 100.0 /100 | #2 | Exceptional 16.4% |
| Immigrants | Hong Kong | 100.0 /100 | #3 | Exceptional 16.5% |
| Immigrants | India | 100.0 /100 | #4 | Exceptional 16.8% |
| Assyrians/Chaldeans/Syriacs | 100.0 /100 | #5 | Exceptional 17.0% |
| Filipinos | 100.0 /100 | #6 | Exceptional 17.0% |
| Thais | 100.0 /100 | #7 | Exceptional 17.3% |
| Immigrants | Iran | 100.0 /100 | #8 | Exceptional 17.5% |
| Bhutanese | 100.0 /100 | #9 | Exceptional 17.7% |
| Immigrants | Ireland | 100.0 /100 | #10 | Exceptional 17.8% |
| Immigrants | Lithuania | 100.0 /100 | #11 | Exceptional 17.8% |
| Immigrants | South Central Asia | 100.0 /100 | #12 | Exceptional 17.8% |
| Immigrants | Bolivia | 100.0 /100 | #13 | Exceptional 17.8% |
| Bolivians | 100.0 /100 | #14 | Exceptional 17.9% |
| Indians (Asian) | 100.0 /100 | #15 | Exceptional 17.9% |
Demographics Similar to Pennsylvania Germans by Single Female Poverty
In terms of single female poverty, the demographic groups most similar to Pennsylvania Germans are Nonimmigrants (23.6%, a difference of 0.080%), Alaskan Athabascan (23.6%, a difference of 0.11%), Immigrants from the Azores (23.5%, a difference of 0.15%), Immigrants from Latin America (23.7%, a difference of 0.60%), and Mexican American Indian (23.4%, a difference of 0.94%).
| Demographics | Rating | Rank | Single Female Poverty |
| Inupiat | 0.2 /100 | #270 | Tragic 23.1% |
| Sub-Saharan Africans | 0.1 /100 | #271 | Tragic 23.2% |
| Immigrants | Senegal | 0.1 /100 | #272 | Tragic 23.2% |
| Alaska Natives | 0.1 /100 | #273 | Tragic 23.3% |
| Marshallese | 0.1 /100 | #274 | Tragic 23.3% |
| Mexican American Indians | 0.1 /100 | #275 | Tragic 23.4% |
| Immigrants | Azores | 0.0 /100 | #276 | Tragic 23.5% |
| Pennsylvania Germans | 0.0 /100 | #277 | Tragic 23.6% |
| Immigrants | Nonimmigrants | 0.0 /100 | #278 | Tragic 23.6% |
| Alaskan Athabascans | 0.0 /100 | #279 | Tragic 23.6% |
| Immigrants | Latin America | 0.0 /100 | #280 | Tragic 23.7% |
| Immigrants | Zaire | 0.0 /100 | #281 | Tragic 23.8% |
| Guatemalans | 0.0 /100 | #282 | Tragic 23.8% |
| German Russians | 0.0 /100 | #283 | Tragic 23.9% |
| Immigrants | Dominica | 0.0 /100 | #284 | Tragic 23.9% |