Immigrants from Syria vs Immigrants from Argentina Female Poverty Among 18-24 Year Olds

COMPARE

Immigrants from Syria
Race
Ancestry
AfghanAfricanAlaska NativeAlaskan AthabascanAlbanianAleutAlsatianAmericanApacheArabArapahoArgentineanArmenianAssyrian/Chaldean/SyriacAustralianAustrianBahamianBangladeshiBarbadianBasqueBelgianBelizeanBermudanBhutaneseBlackfeetBolivianBrazilianBritishBritish West IndianBulgarianBurmeseCajunCambodianCanadianCape VerdeanCarpatho RusynCelticCentral AmericanCentral American IndianCherokeeCheyenneChickasawChileanChineseChippewaChoctawColombianColvilleComancheCosta RicanCreeCreekCroatianCrowCubanCypriotCzechCzechoslovakianDanishDelawareDominicanDutchDutch West IndianEastern EuropeanEcuadorianEgyptianEnglishEstonianEthiopianEuropeanFijianFilipinoFinnishFrenchFrench American IndianFrench CanadianGermanGerman RussianGhanaianGreekGuamanian/ChamorroGuatemalanGuyaneseHaitianHmongHonduranHopiHoumaHungarianIcelanderIndian (Asian)IndonesianInupiatIranianIraqiIrishIroquoisIsraeliItalianJamaicanJapaneseJordanianKenyanKiowaKoreanLaotianLatvianLebaneseLiberianLithuanianLumbeeLuxembourgerMacedonianMalaysianMalteseMarshalleseMenomineeMexicanMexican American IndianMongolianMoroccanNative HawaiianNavajoNepaleseNew ZealanderNicaraguanNigerianNorthern EuropeanNorwegianOkinawanOsageOttawaPaiutePakistaniPalestinianPanamanianParaguayanPennsylvania GermanPeruvianPimaPolishPortuguesePotawatomiPuebloPuerto RicanPuget Sound SalishRomanianRussianSalvadoranSamoanScandinavianScotch-IrishScottishSeminoleSenegaleseSerbianShoshoneSierra LeoneanSiouxSlavicSlovakSloveneSomaliSouth AfricanSouth AmericanSouth American IndianSoviet UnionSpaniardSpanishSpanish AmericanSpanish American IndianSri LankanSubsaharan AfricanSudaneseSwedishSwissSyrianTaiwaneseThaiTlingit-HaidaTohono O'OdhamTonganTrinidadian and TobagonianTsimshianTurkishU.S. Virgin IslanderUgandanUkrainianUruguayanUteVenezuelanVietnameseWelshWest IndianYakamaYaquiYugoslavianYumanYup'ikZimbabwean
Immigration
NonimmigrantsImmigrantsAfghanistanAfricaAlbaniaArmeniaAsiaAustraliaAustriaBahamasBangladeshBarbadosBelarusBelgiumBelizeBoliviaBosnia and HerzegovinaBrazilBulgariaBurma/MyanmarCabo VerdeCambodiaCameroonCanadaCaribbeanCentral AmericaChileChinaColombiaCongoCosta RicaCroatiaCubaCzechoslovakiaDenmarkDominicaDominican RepublicEastern AfricaEastern AsiaEastern EuropeEcuadorEgyptEl SalvadorEnglandEritreaEthiopiaEuropeFijiFranceGermanyGhanaGreeceGrenadaGuatemalaGuyanaHaitiHondurasHong KongHungaryIndiaIndonesiaIranIraqIrelandIsraelItalyJamaicaJapanJordanKazakhstanKenyaKoreaKuwaitLaosLatin AmericaLatviaLebanonLiberiaLithuaniaMalaysiaMexicoMicronesiaMiddle AfricaMoldovaMoroccoNepalNetherlandsNicaraguaNigeriaNorth AmericaNorth MacedoniaNorthern AfricaNorthern EuropeNorwayOceaniaPakistanPanamaPeruPhilippinesPolandPortugalRomaniaRussiaSaudi ArabiaScotlandSenegalSerbiaSierra LeoneSingaporeSomaliaSouth AfricaSouth AmericaSouth Central AsiaSouth Eastern AsiaSouthern EuropeSpainSri LankaSt. Vincent and the GrenadinesSudanSwedenSwitzerlandSyriaTaiwanThailandTrinidad and TobagoTurkeyUgandaUkraineUruguayUzbekistanVenezuelaVietnamWest IndiesWestern AfricaWestern AsiaWestern EuropeYemenZaireZimbabweAzores
Immigrants from Argentina
Race
Ancestry
AfghanAfricanAlaska NativeAlaskan AthabascanAlbanianAleutAlsatianAmericanApacheArabArapahoArgentineanArmenianAssyrian/Chaldean/SyriacAustralianAustrianBahamianBangladeshiBarbadianBasqueBelgianBelizeanBermudanBhutaneseBlackfeetBolivianBrazilianBritishBritish West IndianBulgarianBurmeseCajunCambodianCanadianCape VerdeanCarpatho RusynCelticCentral AmericanCentral American IndianCherokeeCheyenneChickasawChileanChineseChippewaChoctawColombianColvilleComancheCosta RicanCreeCreekCroatianCrowCubanCypriotCzechCzechoslovakianDanishDelawareDominicanDutchDutch West IndianEastern EuropeanEcuadorianEgyptianEnglishEstonianEthiopianEuropeanFijianFilipinoFinnishFrenchFrench American IndianFrench CanadianGermanGerman RussianGhanaianGreekGuamanian/ChamorroGuatemalanGuyaneseHaitianHmongHonduranHopiHoumaHungarianIcelanderIndian (Asian)IndonesianInupiatIranianIraqiIrishIroquoisIsraeliItalianJamaicanJapaneseJordanianKenyanKiowaKoreanLaotianLatvianLebaneseLiberianLithuanianLumbeeLuxembourgerMacedonianMalaysianMalteseMarshalleseMenomineeMexicanMexican American IndianMongolianMoroccanNative HawaiianNavajoNepaleseNew ZealanderNicaraguanNigerianNorthern EuropeanNorwegianOkinawanOsageOttawaPaiutePakistaniPalestinianPanamanianParaguayanPennsylvania GermanPeruvianPimaPolishPortuguesePotawatomiPuebloPuerto RicanPuget Sound SalishRomanianRussianSalvadoranSamoanScandinavianScotch-IrishScottishSeminoleSenegaleseSerbianShoshoneSierra LeoneanSiouxSlavicSlovakSloveneSomaliSouth AfricanSouth AmericanSouth American IndianSoviet UnionSpaniardSpanishSpanish AmericanSpanish American IndianSri LankanSubsaharan AfricanSudaneseSwedishSwissSyrianTaiwaneseThaiTlingit-HaidaTohono O'OdhamTonganTrinidadian and TobagonianTsimshianTurkishU.S. Virgin IslanderUgandanUkrainianUruguayanUteVenezuelanVietnameseWelshWest IndianYakamaYaquiYugoslavianYumanYup'ikZimbabwean
Immigration
NonimmigrantsImmigrantsAfghanistanAfricaAlbaniaArgentinaArmeniaAsiaAustraliaAustriaBahamasBangladeshBarbadosBelarusBelgiumBelizeBoliviaBosnia and HerzegovinaBrazilBulgariaBurma/MyanmarCabo VerdeCambodiaCameroonCanadaCaribbeanCentral AmericaChileChinaColombiaCongoCosta RicaCroatiaCubaCzechoslovakiaDenmarkDominicaDominican RepublicEastern AfricaEastern AsiaEastern EuropeEcuadorEgyptEl SalvadorEnglandEritreaEthiopiaEuropeFijiFranceGermanyGhanaGreeceGrenadaGuatemalaGuyanaHaitiHondurasHong KongHungaryIndiaIndonesiaIranIraqIrelandIsraelItalyJamaicaJapanJordanKazakhstanKenyaKoreaKuwaitLaosLatin AmericaLatviaLebanonLiberiaLithuaniaMalaysiaMexicoMicronesiaMiddle AfricaMoldovaMoroccoNepalNetherlandsNicaraguaNigeriaNorth AmericaNorth MacedoniaNorthern AfricaNorthern EuropeNorwayOceaniaPakistanPanamaPeruPhilippinesPolandPortugalRomaniaRussiaSaudi ArabiaScotlandSenegalSerbiaSierra LeoneSingaporeSomaliaSouth AfricaSouth AmericaSouth Central AsiaSouth Eastern AsiaSouthern EuropeSpainSri LankaSt. Vincent and the GrenadinesSudanSwedenSwitzerlandTaiwanThailandTrinidad and TobagoTurkeyUgandaUkraineUruguayUzbekistanVenezuelaVietnamWest IndiesWestern AfricaWestern AsiaWestern EuropeYemenZaireZimbabweAzores
Female Poverty Among 18-24 Year Olds
Income
Poverty
Unemployment
Labor Participation
Family Structure
Vehicle Availability
Education Level
Disability

Female Poverty Among 18-24 Year Olds Comparison

Immigrants from Syria

Immigrants from Argentina

Exceptional
Exceptional
19.2%
FEMALE POVERTY AMONG 18-24 YEAR OLDS
97.2/ 100
METRIC RATING
109th/ 347
METRIC RANK
18.0%
FEMALE POVERTY AMONG 18-24 YEAR OLDS
100.0/ 100
METRIC RATING
41st/ 347
METRIC RANK

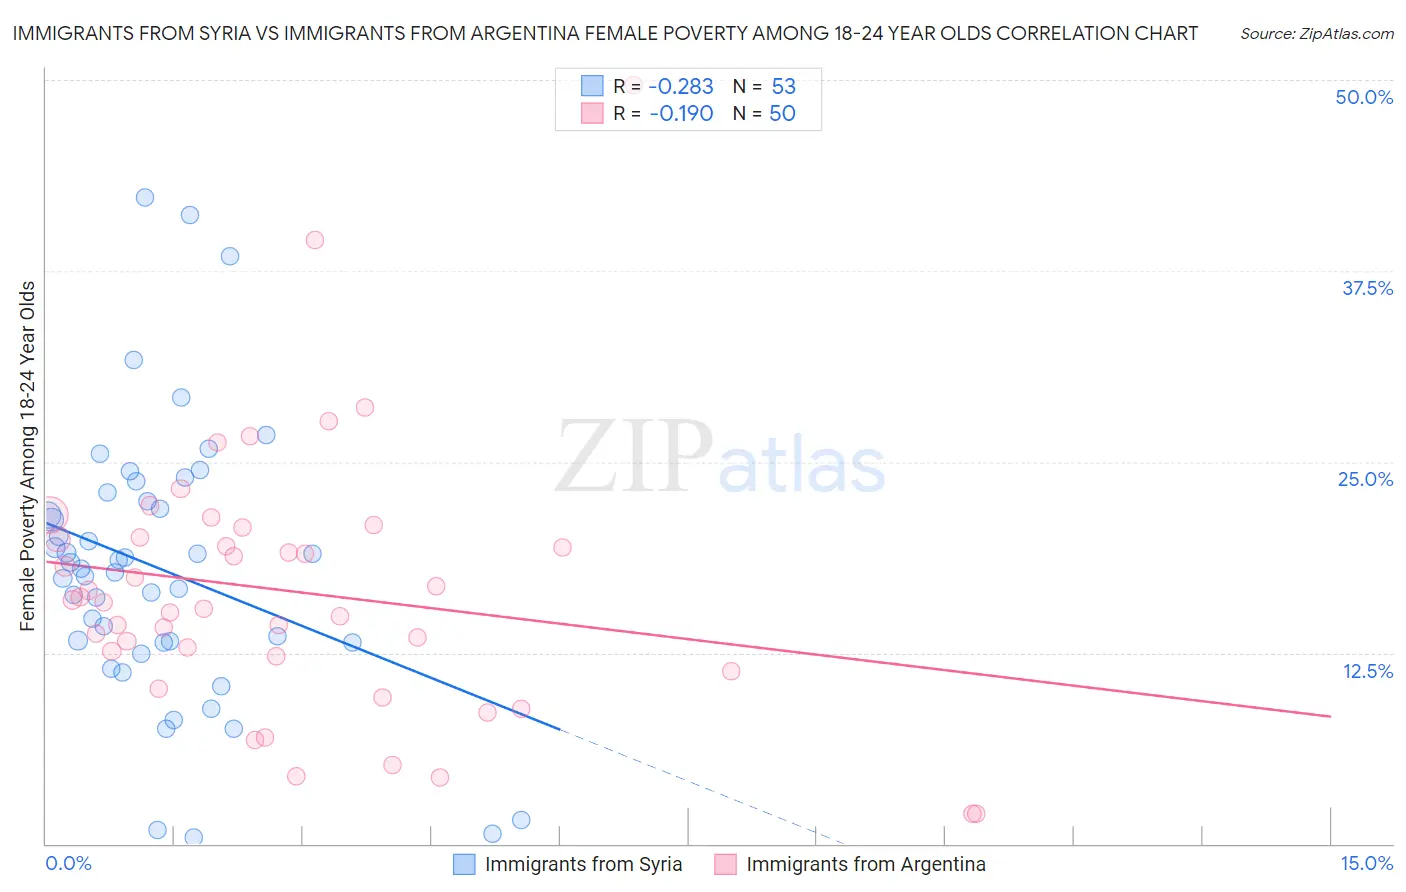
Immigrants from Syria vs Immigrants from Argentina Female Poverty Among 18-24 Year Olds Correlation Chart

The statistical analysis conducted on geographies consisting of 172,353,428 people shows a weak negative correlation between the proportion of Immigrants from Syria and poverty level among females between the ages 18 and 24 in the United States with a correlation coefficient (R) of -0.283 and weighted average of 19.2%. Similarly, the statistical analysis conducted on geographies consisting of 260,510,179 people shows a poor negative correlation between the proportion of Immigrants from Argentina and poverty level among females between the ages 18 and 24 in the United States with a correlation coefficient (R) of -0.190 and weighted average of 18.0%, a difference of 6.9%.
Immigrants from Syria vs Immigrants from Argentina Female Poverty Among 18-24 Year Olds

Female Poverty Among 18-24 Year Olds Correlation Summary

MeasurementImmigrants from SyriaImmigrants from Argentina
Minimum0.42%2.0%
Maximum42.3%49.6%
Range41.9%47.7%
Mean18.0%16.5%
Median18.0%15.9%
Interquartile 25% (IQ1)13.2%12.3%
Interquartile 75% (IQ3)22.7%20.0%
Interquartile Range (IQR)9.5%7.8%
Standard Deviation (Sample)9.0%8.7%
Standard Deviation (Population)8.9%8.6%

Similar Demographics by Female Poverty Among 18-24 Year Olds

Demographics Similar to Immigrants from Syria by Female Poverty Among 18-24 Year Olds

In terms of female poverty among 18-24 year olds, the demographic groups most similar to Immigrants from Syria are Laotian (19.2%, a difference of 0.030%), Immigrants from Serbia (19.2%, a difference of 0.040%), Immigrants from Uzbekistan (19.2%, a difference of 0.080%), Immigrants from Sri Lanka (19.2%, a difference of 0.17%), and Immigrants from El Salvador (19.3%, a difference of 0.27%).
DemographicsRating | RankFemale Poverty Among 18-24 Year Olds
Immigrants | Caribbean
98.1
/100
|
#102
Exceptional
19.1%
Serbians
98.0
/100
|
#103
Exceptional
19.1%
Immigrants | Afghanistan
98.0
/100
|
#104
Exceptional
19.1%
Immigrants | Ecuador
97.8
/100
|
#105
Exceptional
19.2%
Immigrants | Sierra Leone
97.8
/100
|
#106
Exceptional
19.2%
Immigrants | Sri Lanka
97.5
/100
|
#107
Exceptional
19.2%
Immigrants | Uzbekistan
97.3
/100
|
#108
Exceptional
19.2%
Immigrants | Syria
97.2
/100
|
#109
Exceptional
19.2%
Laotians
97.1
/100
|
#110
Exceptional
19.2%
Immigrants | Serbia
97.1
/100
|
#111
Exceptional
19.2%
Immigrants | El Salvador
96.5
/100
|
#112
Exceptional
19.3%
Immigrants | Cameroon
96.3
/100
|
#113
Exceptional
19.3%
Slovenes
96.2
/100
|
#114
Exceptional
19.3%
Immigrants | Hungary
96.2
/100
|
#115
Exceptional
19.3%
Immigrants | Immigrants
95.9
/100
|
#116
Exceptional
19.3%

Demographics Similar to Immigrants from Argentina by Female Poverty Among 18-24 Year Olds

In terms of female poverty among 18-24 year olds, the demographic groups most similar to Immigrants from Argentina are Immigrants from Romania (18.0%, a difference of 0.010%), Puget Sound Salish (18.0%, a difference of 0.040%), South American (18.0%, a difference of 0.25%), Immigrants from Croatia (17.9%, a difference of 0.47%), and Bulgarian (18.1%, a difference of 0.47%).
DemographicsRating | RankFemale Poverty Among 18-24 Year Olds
Immigrants | Nicaragua
100.0
/100
|
#34
Exceptional
17.9%
Immigrants | Greece
100.0
/100
|
#35
Exceptional
17.9%
Immigrants | South America
100.0
/100
|
#36
Exceptional
17.9%
Immigrants | Croatia
100.0
/100
|
#37
Exceptional
17.9%
South Americans
100.0
/100
|
#38
Exceptional
18.0%
Puget Sound Salish
100.0
/100
|
#39
Exceptional
18.0%
Immigrants | Romania
100.0
/100
|
#40
Exceptional
18.0%
Immigrants | Argentina
100.0
/100
|
#41
Exceptional
18.0%
Bulgarians
100.0
/100
|
#42
Exceptional
18.1%
Macedonians
100.0
/100
|
#43
Exceptional
18.1%
Nicaraguans
100.0
/100
|
#44
Exceptional
18.1%
Spanish American Indians
100.0
/100
|
#45
Exceptional
18.1%
Immigrants | Southern Europe
100.0
/100
|
#46
Exceptional
18.2%
Asians
100.0
/100
|
#47
Exceptional
18.2%
Sri Lankans
100.0
/100
|
#48
Exceptional
18.2%