Immigrants from Switzerland vs Portuguese Child Poverty Among Boys Under 16
COMPARE
Immigrants from Switzerland
Portuguese
Child Poverty Among Boys Under 16
Child Poverty Among Boys Under 16 Comparison
Immigrants from Switzerland
Portuguese
15.0%
CHILD POVERTY AMONG BOYS UNDER 16
95.4/ 100
METRIC RATING
104th/ 347
METRIC RANK
15.5%
CHILD POVERTY AMONG BOYS UNDER 16
87.5/ 100
METRIC RATING
135th/ 347
METRIC RANK
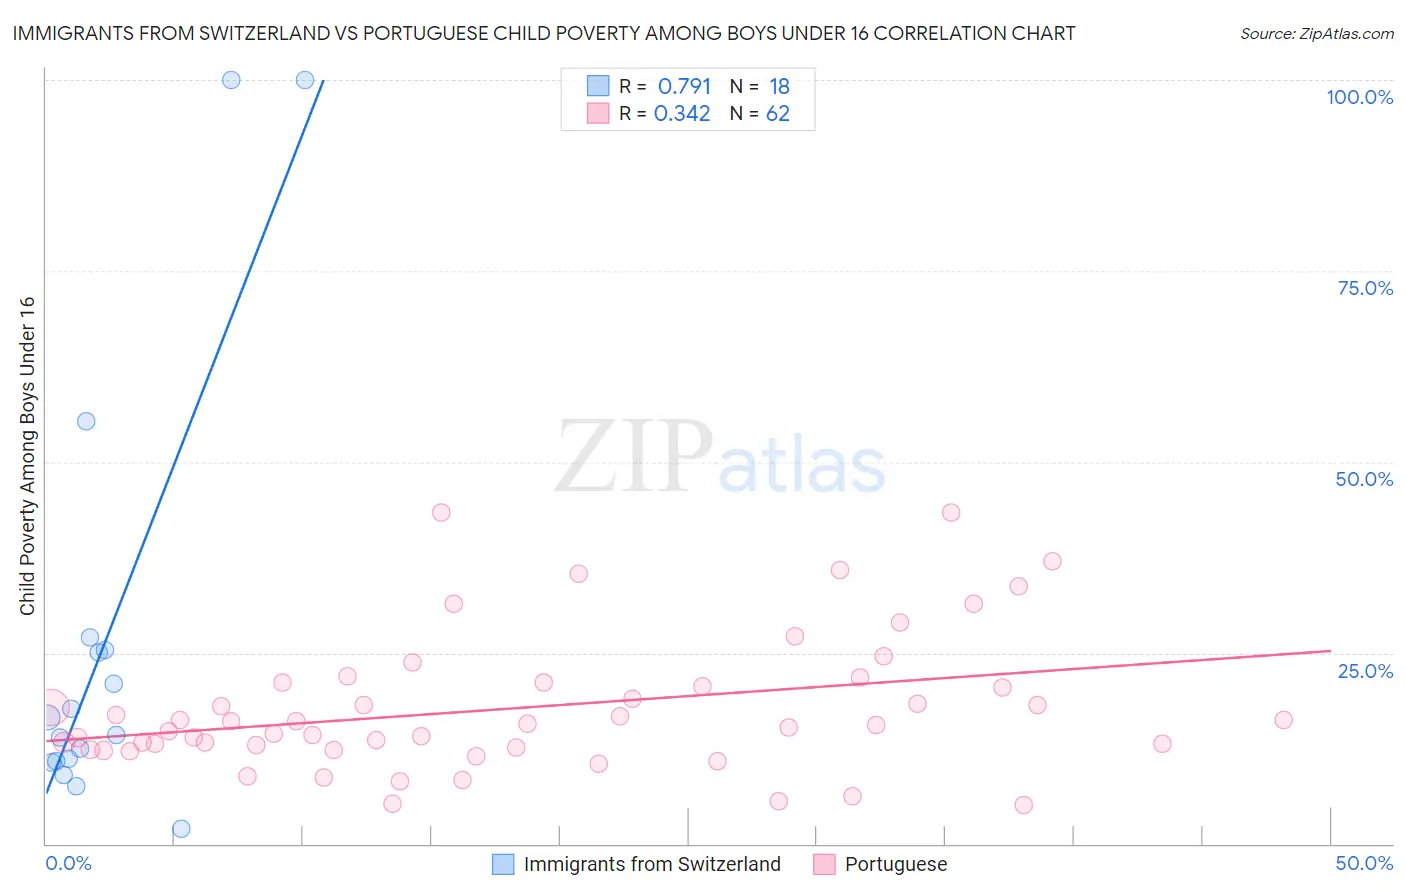
Immigrants from Switzerland vs Portuguese Child Poverty Among Boys Under 16 Correlation Chart
The statistical analysis conducted on geographies consisting of 146,543,918 people shows a strong positive correlation between the proportion of Immigrants from Switzerland and poverty level among boys under the age of 16 in the United States with a correlation coefficient (R) of 0.791 and weighted average of 15.0%. Similarly, the statistical analysis conducted on geographies consisting of 440,037,497 people shows a mild positive correlation between the proportion of Portuguese and poverty level among boys under the age of 16 in the United States with a correlation coefficient (R) of 0.342 and weighted average of 15.5%, a difference of 3.3%.
Child Poverty Among Boys Under 16 Correlation Summary
| Measurement | Immigrants from Switzerland | Portuguese |
| Minimum | 2.0% | 5.1% |
| Maximum | 100.0% | 43.4% |
| Range | 98.0% | 38.3% |
| Mean | 26.6% | 17.8% |
| Median | 15.4% | 15.6% |
| Interquartile 25% (IQ1) | 10.8% | 12.6% |
| Interquartile 75% (IQ3) | 25.4% | 21.1% |
| Interquartile Range (IQR) | 14.6% | 8.4% |
| Standard Deviation (Sample) | 29.1% | 8.9% |
| Standard Deviation (Population) | 28.2% | 8.8% |
Similar Demographics by Child Poverty Among Boys Under 16
Demographics Similar to Immigrants from Switzerland by Child Poverty Among Boys Under 16
In terms of child poverty among boys under 16, the demographic groups most similar to Immigrants from Switzerland are Dutch (15.0%, a difference of 0.010%), Immigrants from Denmark (15.0%, a difference of 0.10%), Serbian (15.1%, a difference of 0.13%), Romanian (15.0%, a difference of 0.14%), and Immigrants from Belarus (15.0%, a difference of 0.21%).
| Demographics | Rating | Rank | Child Poverty Among Boys Under 16 |
| Immigrants | Egypt | 96.2 /100 | #97 | Exceptional 14.9% |
| British | 96.2 /100 | #98 | Exceptional 15.0% |
| Immigrants | France | 96.1 /100 | #99 | Exceptional 15.0% |
| Chileans | 95.8 /100 | #100 | Exceptional 15.0% |
| Immigrants | Belarus | 95.7 /100 | #101 | Exceptional 15.0% |
| Romanians | 95.6 /100 | #102 | Exceptional 15.0% |
| Immigrants | Denmark | 95.6 /100 | #103 | Exceptional 15.0% |
| Immigrants | Switzerland | 95.4 /100 | #104 | Exceptional 15.0% |
| Dutch | 95.4 /100 | #105 | Exceptional 15.0% |
| Serbians | 95.2 /100 | #106 | Exceptional 15.1% |
| Jordanians | 95.1 /100 | #107 | Exceptional 15.1% |
| Immigrants | England | 94.8 /100 | #108 | Exceptional 15.1% |
| Pakistanis | 94.7 /100 | #109 | Exceptional 15.1% |
| English | 94.3 /100 | #110 | Exceptional 15.1% |
| Immigrants | Zimbabwe | 94.2 /100 | #111 | Exceptional 15.2% |
Demographics Similar to Portuguese by Child Poverty Among Boys Under 16
In terms of child poverty among boys under 16, the demographic groups most similar to Portuguese are Icelander (15.5%, a difference of 0.010%), Immigrants from Spain (15.6%, a difference of 0.11%), Peruvian (15.5%, a difference of 0.17%), Welsh (15.5%, a difference of 0.21%), and Immigrants from Southern Europe (15.6%, a difference of 0.26%).
| Demographics | Rating | Rank | Child Poverty Among Boys Under 16 |
| Canadians | 90.6 /100 | #128 | Exceptional 15.4% |
| Immigrants | Brazil | 90.3 /100 | #129 | Exceptional 15.4% |
| Mongolians | 90.2 /100 | #130 | Exceptional 15.4% |
| Immigrants | Western Europe | 90.0 /100 | #131 | Exceptional 15.4% |
| Immigrants | Kazakhstan | 88.7 /100 | #132 | Excellent 15.5% |
| Welsh | 88.3 /100 | #133 | Excellent 15.5% |
| Peruvians | 88.1 /100 | #134 | Excellent 15.5% |
| Portuguese | 87.5 /100 | #135 | Excellent 15.5% |
| Icelanders | 87.5 /100 | #136 | Excellent 15.5% |
| Immigrants | Spain | 87.1 /100 | #137 | Excellent 15.6% |
| Immigrants | Southern Europe | 86.5 /100 | #138 | Excellent 15.6% |
| Albanians | 86.5 /100 | #139 | Excellent 15.6% |
| Immigrants | Kuwait | 85.6 /100 | #140 | Excellent 15.6% |
| Slavs | 84.5 /100 | #141 | Excellent 15.7% |
| Immigrants | Hungary | 84.1 /100 | #142 | Excellent 15.7% |