Immigrants from Sweden vs Immigrants from Austria Child Poverty Among Boys Under 16

COMPARE

Immigrants from Sweden
Race
Ancestry
AfghanAfricanAlaska NativeAlaskan AthabascanAlbanianAleutAlsatianAmericanApacheArabArapahoArgentineanArmenianAssyrian/Chaldean/SyriacAustralianAustrianBahamianBangladeshiBarbadianBasqueBelgianBelizeanBermudanBhutaneseBlackfeetBolivianBrazilianBritishBritish West IndianBulgarianBurmeseCajunCambodianCanadianCape VerdeanCarpatho RusynCelticCentral AmericanCentral American IndianCherokeeCheyenneChickasawChileanChineseChippewaChoctawColombianColvilleComancheCosta RicanCreeCreekCroatianCrowCubanCypriotCzechCzechoslovakianDanishDelawareDominicanDutchDutch West IndianEastern EuropeanEcuadorianEgyptianEnglishEstonianEthiopianEuropeanFijianFilipinoFinnishFrenchFrench American IndianFrench CanadianGermanGerman RussianGhanaianGreekGuamanian/ChamorroGuatemalanGuyaneseHaitianHmongHonduranHopiHoumaHungarianIcelanderIndian (Asian)IndonesianInupiatIranianIraqiIrishIroquoisIsraeliItalianJamaicanJapaneseJordanianKenyanKiowaKoreanLaotianLatvianLebaneseLiberianLithuanianLumbeeLuxembourgerMacedonianMalaysianMalteseMarshalleseMenomineeMexicanMexican American IndianMongolianMoroccanNative HawaiianNavajoNepaleseNew ZealanderNicaraguanNigerianNorthern EuropeanNorwegianOkinawanOsageOttawaPaiutePakistaniPalestinianPanamanianParaguayanPennsylvania GermanPeruvianPimaPolishPortuguesePotawatomiPuebloPuerto RicanPuget Sound SalishRomanianRussianSalvadoranSamoanScandinavianScotch-IrishScottishSeminoleSenegaleseSerbianShoshoneSierra LeoneanSiouxSlavicSlovakSloveneSomaliSouth AfricanSouth AmericanSouth American IndianSoviet UnionSpaniardSpanishSpanish AmericanSpanish American IndianSri LankanSubsaharan AfricanSudaneseSwedishSwissSyrianTaiwaneseThaiTlingit-HaidaTohono O'OdhamTonganTrinidadian and TobagonianTsimshianTurkishU.S. Virgin IslanderUgandanUkrainianUruguayanUteVenezuelanVietnameseWelshWest IndianYakamaYaquiYugoslavianYumanYup'ikZimbabwean
Immigration
NonimmigrantsImmigrantsAfghanistanAfricaAlbaniaArgentinaArmeniaAsiaAustraliaBahamasBangladeshBarbadosBelarusBelgiumBelizeBoliviaBosnia and HerzegovinaBrazilBulgariaBurma/MyanmarCabo VerdeCambodiaCameroonCanadaCaribbeanCentral AmericaChileChinaColombiaCongoCosta RicaCroatiaCubaCzechoslovakiaDenmarkDominicaDominican RepublicEastern AfricaEastern AsiaEastern EuropeEcuadorEgyptEl SalvadorEnglandEritreaEthiopiaEuropeFijiFranceGermanyGhanaGreeceGrenadaGuatemalaGuyanaHaitiHondurasHong KongHungaryIndiaIndonesiaIranIraqIrelandIsraelItalyJamaicaJapanJordanKazakhstanKenyaKoreaKuwaitLaosLatin AmericaLatviaLebanonLiberiaLithuaniaMalaysiaMexicoMicronesiaMiddle AfricaMoldovaMoroccoNepalNetherlandsNicaraguaNigeriaNorth AmericaNorth MacedoniaNorthern AfricaNorthern EuropeNorwayOceaniaPakistanPanamaPeruPhilippinesPolandPortugalRomaniaRussiaSaudi ArabiaScotlandSenegalSerbiaSierra LeoneSingaporeSomaliaSouth AfricaSouth AmericaSouth Central AsiaSouth Eastern AsiaSouthern EuropeSpainSri LankaSt. Vincent and the GrenadinesSudanSwedenSwitzerlandSyriaTaiwanThailandTrinidad and TobagoTurkeyUgandaUkraineUruguayUzbekistanVenezuelaVietnamWest IndiesWestern AfricaWestern AsiaWestern EuropeYemenZaireZimbabweAzores
Immigrants from Austria
Race
Ancestry
AfghanAfricanAlaska NativeAlaskan AthabascanAlbanianAleutAlsatianAmericanApacheArabArapahoArgentineanArmenianAssyrian/Chaldean/SyriacAustralianAustrianBahamianBangladeshiBarbadianBasqueBelgianBelizeanBermudanBhutaneseBlackfeetBolivianBrazilianBritishBritish West IndianBulgarianBurmeseCajunCambodianCanadianCape VerdeanCarpatho RusynCelticCentral AmericanCentral American IndianCherokeeCheyenneChickasawChileanChineseChippewaChoctawColombianColvilleComancheCosta RicanCreeCreekCroatianCrowCubanCypriotCzechCzechoslovakianDanishDelawareDominicanDutchDutch West IndianEastern EuropeanEcuadorianEgyptianEnglishEstonianEthiopianEuropeanFijianFilipinoFinnishFrenchFrench American IndianFrench CanadianGermanGerman RussianGhanaianGreekGuamanian/ChamorroGuatemalanGuyaneseHaitianHmongHonduranHopiHoumaHungarianIcelanderIndian (Asian)IndonesianInupiatIranianIraqiIrishIroquoisIsraeliItalianJamaicanJapaneseJordanianKenyanKiowaKoreanLaotianLatvianLebaneseLiberianLithuanianLumbeeLuxembourgerMacedonianMalaysianMalteseMarshalleseMenomineeMexicanMexican American IndianMongolianMoroccanNative HawaiianNavajoNepaleseNew ZealanderNicaraguanNigerianNorthern EuropeanNorwegianOkinawanOsageOttawaPaiutePakistaniPalestinianPanamanianParaguayanPennsylvania GermanPeruvianPimaPolishPortuguesePotawatomiPuebloPuerto RicanPuget Sound SalishRomanianRussianSalvadoranSamoanScandinavianScotch-IrishScottishSeminoleSenegaleseSerbianShoshoneSierra LeoneanSiouxSlavicSlovakSloveneSomaliSouth AfricanSouth AmericanSouth American IndianSoviet UnionSpaniardSpanishSpanish AmericanSpanish American IndianSri LankanSubsaharan AfricanSudaneseSwedishSwissSyrianTaiwaneseThaiTlingit-HaidaTohono O'OdhamTonganTrinidadian and TobagonianTsimshianTurkishU.S. Virgin IslanderUgandanUkrainianUruguayanUteVenezuelanVietnameseWelshWest IndianYakamaYaquiYugoslavianYumanYup'ikZimbabwean
Immigration
NonimmigrantsImmigrantsAfghanistanAfricaAlbaniaArgentinaArmeniaAsiaAustraliaAustriaBahamasBangladeshBarbadosBelarusBelgiumBelizeBoliviaBosnia and HerzegovinaBrazilBulgariaBurma/MyanmarCabo VerdeCambodiaCameroonCanadaCaribbeanCentral AmericaChileChinaColombiaCongoCosta RicaCroatiaCubaCzechoslovakiaDenmarkDominicaDominican RepublicEastern AfricaEastern AsiaEastern EuropeEcuadorEgyptEl SalvadorEnglandEritreaEthiopiaEuropeFijiFranceGermanyGhanaGreeceGrenadaGuatemalaGuyanaHaitiHondurasHong KongHungaryIndiaIndonesiaIranIraqIrelandIsraelItalyJamaicaJapanJordanKazakhstanKenyaKoreaKuwaitLaosLatin AmericaLatviaLebanonLiberiaLithuaniaMalaysiaMexicoMicronesiaMiddle AfricaMoldovaMoroccoNepalNetherlandsNicaraguaNigeriaNorth AmericaNorth MacedoniaNorthern AfricaNorthern EuropeNorwayOceaniaPakistanPanamaPeruPhilippinesPolandPortugalRomaniaRussiaSaudi ArabiaScotlandSenegalSerbiaSierra LeoneSingaporeSomaliaSouth AfricaSouth AmericaSouth Central AsiaSouth Eastern AsiaSouthern EuropeSpainSri LankaSt. Vincent and the GrenadinesSudanSwitzerlandSyriaTaiwanThailandTrinidad and TobagoTurkeyUgandaUkraineUruguayUzbekistanVenezuelaVietnamWest IndiesWestern AfricaWestern AsiaWestern EuropeYemenZaireZimbabweAzores
Child Poverty Among Boys Under 16
Income
Poverty
Unemployment
Labor Participation
Family Structure
Vehicle Availability
Education Level
Disability

Child Poverty Among Boys Under 16 Comparison

Immigrants from Sweden

Immigrants from Austria

Exceptional
Exceptional
14.4%
CHILD POVERTY AMONG BOYS UNDER 16
98.9/ 100
METRIC RATING
58th/ 347
METRIC RANK
14.5%
CHILD POVERTY AMONG BOYS UNDER 16
98.4/ 100
METRIC RATING
69th/ 347
METRIC RANK

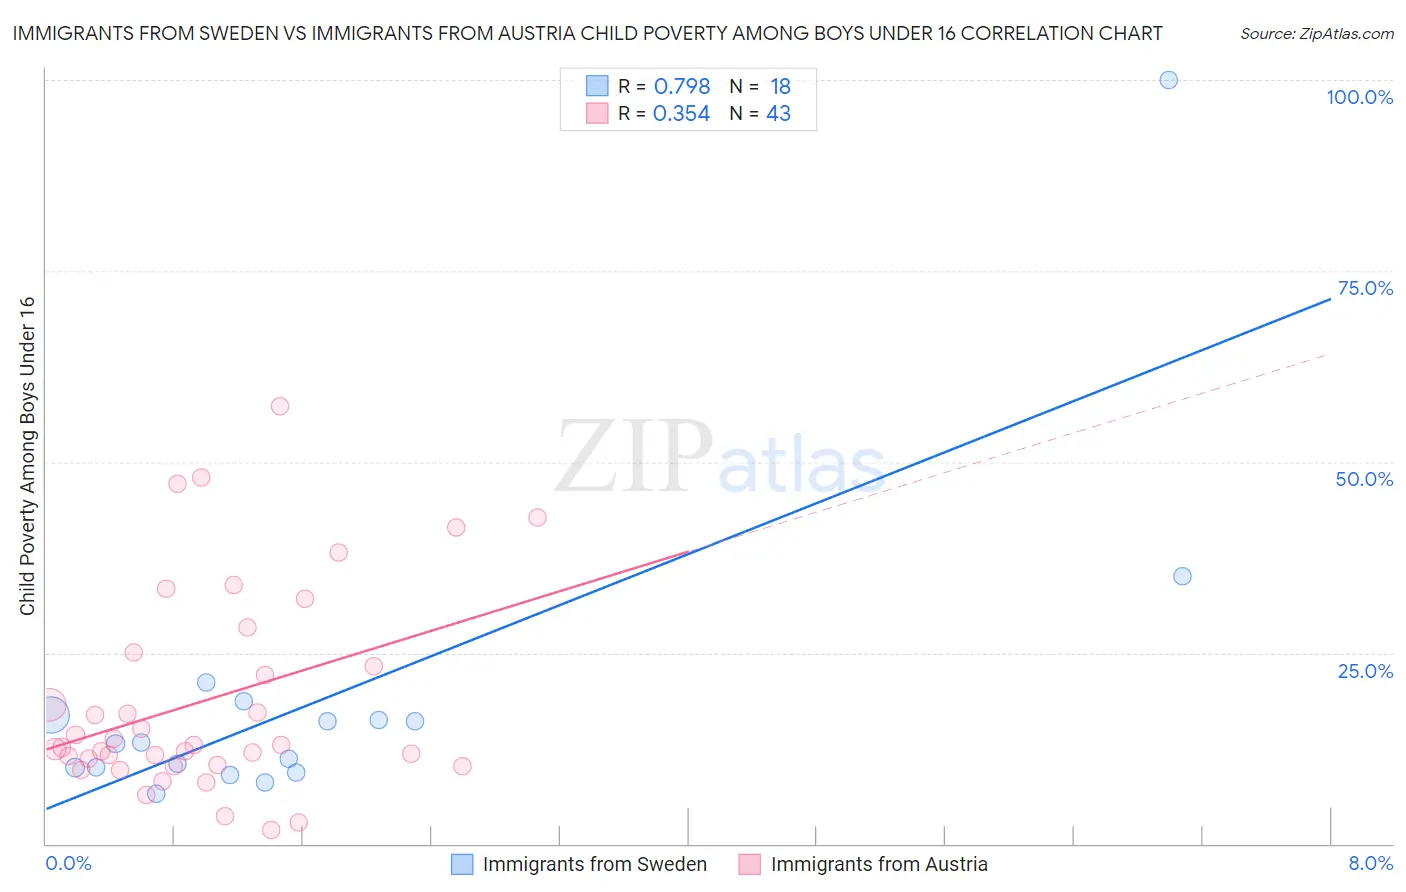
Immigrants from Sweden vs Immigrants from Austria Child Poverty Among Boys Under 16 Correlation Chart

The statistical analysis conducted on geographies consisting of 162,746,635 people shows a strong positive correlation between the proportion of Immigrants from Sweden and poverty level among boys under the age of 16 in the United States with a correlation coefficient (R) of 0.798 and weighted average of 14.4%. Similarly, the statistical analysis conducted on geographies consisting of 165,951,164 people shows a mild positive correlation between the proportion of Immigrants from Austria and poverty level among boys under the age of 16 in the United States with a correlation coefficient (R) of 0.354 and weighted average of 14.5%, a difference of 1.2%.
Immigrants from Sweden vs Immigrants from Austria Child Poverty Among Boys Under 16

Child Poverty Among Boys Under 16 Correlation Summary

MeasurementImmigrants from SwedenImmigrants from Austria
Minimum6.6%1.7%
Maximum100.0%57.2%
Range93.4%55.5%
Mean18.9%18.8%
Median13.2%12.9%
Interquartile 25% (IQ1)10.0%10.3%
Interquartile 75% (IQ3)16.8%25.0%
Interquartile Range (IQR)6.8%14.7%
Standard Deviation (Sample)21.3%13.4%
Standard Deviation (Population)20.7%13.2%

Demographics Similar to Immigrants from Sweden and Immigrants from Austria by Child Poverty Among Boys Under 16

In terms of child poverty among boys under 16, the demographic groups most similar to Immigrants from Sweden are Immigrants from Czechoslovakia (14.4%, a difference of 0.020%), Immigrants from Belgium (14.4%, a difference of 0.040%), Polish (14.4%, a difference of 0.080%), Scandinavian (14.4%, a difference of 0.16%), and Immigrants from Pakistan (14.3%, a difference of 0.18%). Similarly, the demographic groups most similar to Immigrants from Austria are European (14.5%, a difference of 0.0%), Slovene (14.5%, a difference of 0.030%), Immigrants from Europe (14.5%, a difference of 0.12%), Immigrants from Bulgaria (14.5%, a difference of 0.15%), and Soviet Union (14.5%, a difference of 0.16%).
DemographicsRating | RankChild Poverty Among Boys Under 16
Immigrants | Philippines
99.0
/100
|
#53
Exceptional
14.3%
Immigrants | Serbia
99.0
/100
|
#54
Exceptional
14.3%
Immigrants | Pakistan
99.0
/100
|
#55
Exceptional
14.3%
Zimbabweans
99.0
/100
|
#56
Exceptional
14.3%
Poles
98.9
/100
|
#57
Exceptional
14.4%
Immigrants | Sweden
98.9
/100
|
#58
Exceptional
14.4%
Immigrants | Czechoslovakia
98.9
/100
|
#59
Exceptional
14.4%
Immigrants | Belgium
98.9
/100
|
#60
Exceptional
14.4%
Scandinavians
98.8
/100
|
#61
Exceptional
14.4%
Immigrants | Israel
98.7
/100
|
#62
Exceptional
14.4%
Cambodians
98.5
/100
|
#63
Exceptional
14.5%
Immigrants | Romania
98.5
/100
|
#64
Exceptional
14.5%
Soviet Union
98.5
/100
|
#65
Exceptional
14.5%
Immigrants | Bulgaria
98.5
/100
|
#66
Exceptional
14.5%
Immigrants | Europe
98.4
/100
|
#67
Exceptional
14.5%
Slovenes
98.4
/100
|
#68
Exceptional
14.5%
Immigrants | Austria
98.4
/100
|
#69
Exceptional
14.5%
Europeans
98.4
/100
|
#70
Exceptional
14.5%
Immigrants | Netherlands
98.1
/100
|
#71
Exceptional
14.6%
Immigrants | Latvia
98.1
/100
|
#72
Exceptional
14.6%
Immigrants | Turkey
98.0
/100
|
#73
Exceptional
14.6%