Immigrants from Sudan vs Pakistani Single Male Poverty
COMPARE
Immigrants from Sudan
Pakistani
Single Male Poverty
Single Male Poverty Comparison
Immigrants from Sudan
Pakistanis
12.7%
SINGLE MALE POVERTY
58.2/ 100
METRIC RATING
167th/ 347
METRIC RANK
12.4%
SINGLE MALE POVERTY
92.4/ 100
METRIC RATING
113th/ 347
METRIC RANK
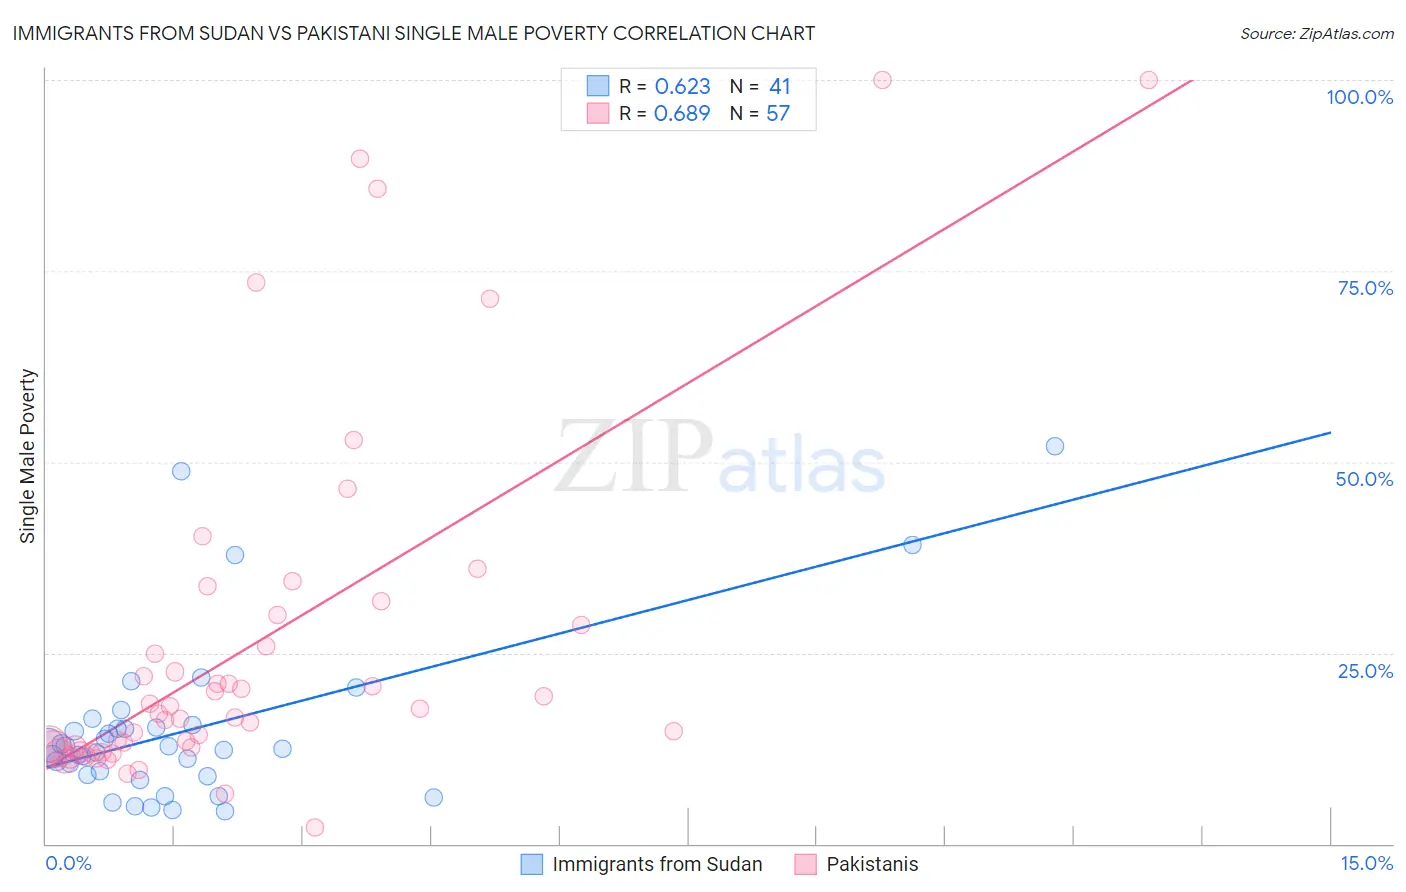
Immigrants from Sudan vs Pakistani Single Male Poverty Correlation Chart
The statistical analysis conducted on geographies consisting of 114,680,115 people shows a significant positive correlation between the proportion of Immigrants from Sudan and poverty level among single males in the United States with a correlation coefficient (R) of 0.623 and weighted average of 12.7%. Similarly, the statistical analysis conducted on geographies consisting of 304,084,454 people shows a significant positive correlation between the proportion of Pakistanis and poverty level among single males in the United States with a correlation coefficient (R) of 0.689 and weighted average of 12.4%, a difference of 2.9%.
Single Male Poverty Correlation Summary
| Measurement | Immigrants from Sudan | Pakistani |
| Minimum | 4.2% | 2.1% |
| Maximum | 52.0% | 100.0% |
| Range | 47.8% | 97.9% |
| Mean | 14.9% | 26.1% |
| Median | 12.5% | 17.0% |
| Interquartile 25% (IQ1) | 8.9% | 12.3% |
| Interquartile 75% (IQ3) | 15.4% | 29.3% |
| Interquartile Range (IQR) | 6.5% | 17.0% |
| Standard Deviation (Sample) | 10.9% | 23.4% |
| Standard Deviation (Population) | 10.8% | 23.2% |
Similar Demographics by Single Male Poverty
Demographics Similar to Immigrants from Sudan by Single Male Poverty
In terms of single male poverty, the demographic groups most similar to Immigrants from Sudan are Immigrants from Barbados (12.7%, a difference of 0.030%), Immigrants from Guyana (12.7%, a difference of 0.13%), Puget Sound Salish (12.8%, a difference of 0.21%), Immigrants from Cambodia (12.7%, a difference of 0.22%), and Immigrants from Nigeria (12.7%, a difference of 0.26%).
| Demographics | Rating | Rank | Single Male Poverty |
| Greeks | 64.1 /100 | #160 | Good 12.7% |
| Immigrants | Africa | 63.4 /100 | #161 | Good 12.7% |
| Eastern Europeans | 63.3 /100 | #162 | Good 12.7% |
| Palestinians | 63.1 /100 | #163 | Good 12.7% |
| Immigrants | Nigeria | 62.8 /100 | #164 | Good 12.7% |
| Immigrants | Cambodia | 62.2 /100 | #165 | Good 12.7% |
| Immigrants | Guyana | 60.5 /100 | #166 | Good 12.7% |
| Immigrants | Sudan | 58.2 /100 | #167 | Average 12.7% |
| Immigrants | Barbados | 57.7 /100 | #168 | Average 12.7% |
| Puget Sound Salish | 54.3 /100 | #169 | Average 12.8% |
| Guyanese | 52.0 /100 | #170 | Average 12.8% |
| South Africans | 51.5 /100 | #171 | Average 12.8% |
| Danes | 51.4 /100 | #172 | Average 12.8% |
| Immigrants | St. Vincent and the Grenadines | 50.9 /100 | #173 | Average 12.8% |
| Costa Ricans | 50.0 /100 | #174 | Average 12.8% |
Demographics Similar to Pakistanis by Single Male Poverty
In terms of single male poverty, the demographic groups most similar to Pakistanis are Nicaraguan (12.4%, a difference of 0.050%), Immigrants from Southern Europe (12.4%, a difference of 0.15%), Kenyan (12.4%, a difference of 0.19%), Immigrants from Syria (12.4%, a difference of 0.21%), and Immigrants from Oceania (12.4%, a difference of 0.22%).
| Demographics | Rating | Rank | Single Male Poverty |
| Immigrants | Morocco | 95.6 /100 | #106 | Exceptional 12.3% |
| Iraqis | 95.1 /100 | #107 | Exceptional 12.3% |
| Immigrants | Eastern Africa | 95.0 /100 | #108 | Exceptional 12.3% |
| Ugandans | 94.5 /100 | #109 | Exceptional 12.3% |
| Immigrants | Portugal | 93.6 /100 | #110 | Exceptional 12.3% |
| Immigrants | North Macedonia | 93.6 /100 | #111 | Exceptional 12.3% |
| Kenyans | 93.3 /100 | #112 | Exceptional 12.4% |
| Pakistanis | 92.4 /100 | #113 | Exceptional 12.4% |
| Nicaraguans | 92.1 /100 | #114 | Exceptional 12.4% |
| Immigrants | Southern Europe | 91.5 /100 | #115 | Exceptional 12.4% |
| Immigrants | Syria | 91.2 /100 | #116 | Exceptional 12.4% |
| Immigrants | Oceania | 91.1 /100 | #117 | Exceptional 12.4% |
| Albanians | 90.6 /100 | #118 | Exceptional 12.4% |
| Immigrants | Albania | 90.3 /100 | #119 | Exceptional 12.4% |
| Venezuelans | 89.4 /100 | #120 | Excellent 12.4% |