Immigrants from Sudan vs Immigrants from Afghanistan Child Poverty Among Boys Under 16
COMPARE
Immigrants from Sudan
Immigrants from Afghanistan
Child Poverty Among Boys Under 16
Child Poverty Among Boys Under 16 Comparison
Immigrants from Sudan
Immigrants from Afghanistan
18.8%
CHILD POVERTY AMONG BOYS UNDER 16
0.6/ 100
METRIC RATING
241st/ 347
METRIC RANK
17.3%
CHILD POVERTY AMONG BOYS UNDER 16
13.7/ 100
METRIC RATING
201st/ 347
METRIC RANK
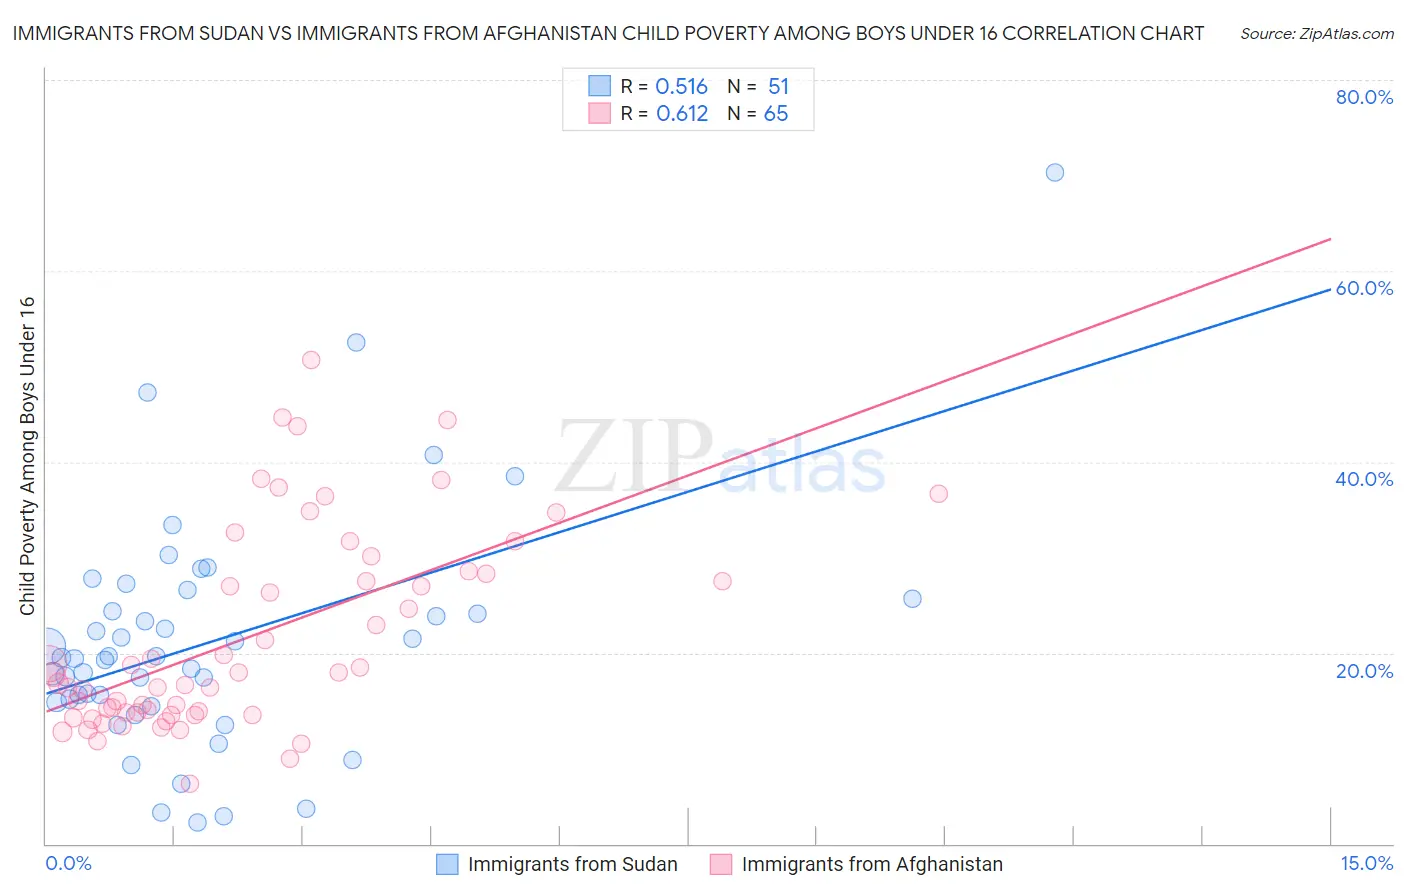
Immigrants from Sudan vs Immigrants from Afghanistan Child Poverty Among Boys Under 16 Correlation Chart
The statistical analysis conducted on geographies consisting of 118,648,012 people shows a substantial positive correlation between the proportion of Immigrants from Sudan and poverty level among boys under the age of 16 in the United States with a correlation coefficient (R) of 0.516 and weighted average of 18.8%. Similarly, the statistical analysis conducted on geographies consisting of 146,910,651 people shows a significant positive correlation between the proportion of Immigrants from Afghanistan and poverty level among boys under the age of 16 in the United States with a correlation coefficient (R) of 0.612 and weighted average of 17.3%, a difference of 8.7%.
Child Poverty Among Boys Under 16 Correlation Summary
| Measurement | Immigrants from Sudan | Immigrants from Afghanistan |
| Minimum | 2.2% | 6.2% |
| Maximum | 70.3% | 50.7% |
| Range | 68.1% | 44.5% |
| Mean | 21.2% | 21.6% |
| Median | 19.4% | 17.7% |
| Interquartile 25% (IQ1) | 14.8% | 13.6% |
| Interquartile 75% (IQ3) | 25.6% | 28.4% |
| Interquartile Range (IQR) | 10.8% | 14.8% |
| Standard Deviation (Sample) | 12.5% | 10.5% |
| Standard Deviation (Population) | 12.3% | 10.4% |
Similar Demographics by Child Poverty Among Boys Under 16
Demographics Similar to Immigrants from Sudan by Child Poverty Among Boys Under 16
In terms of child poverty among boys under 16, the demographic groups most similar to Immigrants from Sudan are Immigrants from Cuba (18.8%, a difference of 0.050%), Cape Verdean (18.7%, a difference of 0.39%), Ghanaian (18.9%, a difference of 0.50%), Immigrants from Laos (18.7%, a difference of 0.63%), and Immigrants from the Azores (18.9%, a difference of 0.84%).
| Demographics | Rating | Rank | Child Poverty Among Boys Under 16 |
| Nigerians | 1.1 /100 | #234 | Tragic 18.5% |
| Americans | 0.9 /100 | #235 | Tragic 18.6% |
| Sudanese | 0.9 /100 | #236 | Tragic 18.6% |
| Immigrants | Eritrea | 0.8 /100 | #237 | Tragic 18.6% |
| Immigrants | Laos | 0.8 /100 | #238 | Tragic 18.7% |
| Cape Verdeans | 0.7 /100 | #239 | Tragic 18.7% |
| Immigrants | Cuba | 0.6 /100 | #240 | Tragic 18.8% |
| Immigrants | Sudan | 0.6 /100 | #241 | Tragic 18.8% |
| Ghanaians | 0.5 /100 | #242 | Tragic 18.9% |
| Immigrants | Azores | 0.4 /100 | #243 | Tragic 18.9% |
| Immigrants | Middle Africa | 0.4 /100 | #244 | Tragic 18.9% |
| Cree | 0.4 /100 | #245 | Tragic 19.0% |
| Immigrants | Nicaragua | 0.4 /100 | #246 | Tragic 19.0% |
| Immigrants | Trinidad and Tobago | 0.3 /100 | #247 | Tragic 19.0% |
| Salvadorans | 0.3 /100 | #248 | Tragic 19.0% |
Demographics Similar to Immigrants from Afghanistan by Child Poverty Among Boys Under 16
In terms of child poverty among boys under 16, the demographic groups most similar to Immigrants from Afghanistan are Immigrants from Sierra Leone (17.3%, a difference of 0.060%), Immigrants from Uzbekistan (17.3%, a difference of 0.080%), Ugandan (17.3%, a difference of 0.28%), Immigrants from Portugal (17.4%, a difference of 0.62%), and Immigrants from Uruguay (17.2%, a difference of 0.68%).
| Demographics | Rating | Rank | Child Poverty Among Boys Under 16 |
| Immigrants | Lebanon | 21.2 /100 | #194 | Fair 17.0% |
| Spanish | 20.8 /100 | #195 | Fair 17.0% |
| Spaniards | 20.5 /100 | #196 | Fair 17.1% |
| Immigrants | Kenya | 20.1 /100 | #197 | Fair 17.1% |
| Immigrants | Cameroon | 19.0 /100 | #198 | Poor 17.1% |
| Delaware | 18.8 /100 | #199 | Poor 17.1% |
| Immigrants | Uruguay | 16.9 /100 | #200 | Poor 17.2% |
| Immigrants | Afghanistan | 13.7 /100 | #201 | Poor 17.3% |
| Immigrants | Sierra Leone | 13.4 /100 | #202 | Poor 17.3% |
| Immigrants | Uzbekistan | 13.3 /100 | #203 | Poor 17.3% |
| Ugandans | 12.5 /100 | #204 | Poor 17.3% |
| Immigrants | Portugal | 11.2 /100 | #205 | Poor 17.4% |
| German Russians | 10.9 /100 | #206 | Poor 17.4% |
| Immigrants | Thailand | 8.2 /100 | #207 | Tragic 17.5% |
| Malaysians | 7.6 /100 | #208 | Tragic 17.6% |