Immigrants from Sudan vs Colombian Female Poverty
COMPARE
Immigrants from Sudan
Colombian
Female Poverty
Female Poverty Comparison
Immigrants from Sudan
Colombians
15.2%
FEMALE POVERTY
0.4/ 100
METRIC RATING
241st/ 347
METRIC RANK
13.4%
FEMALE POVERTY
55.7/ 100
METRIC RATING
170th/ 347
METRIC RANK
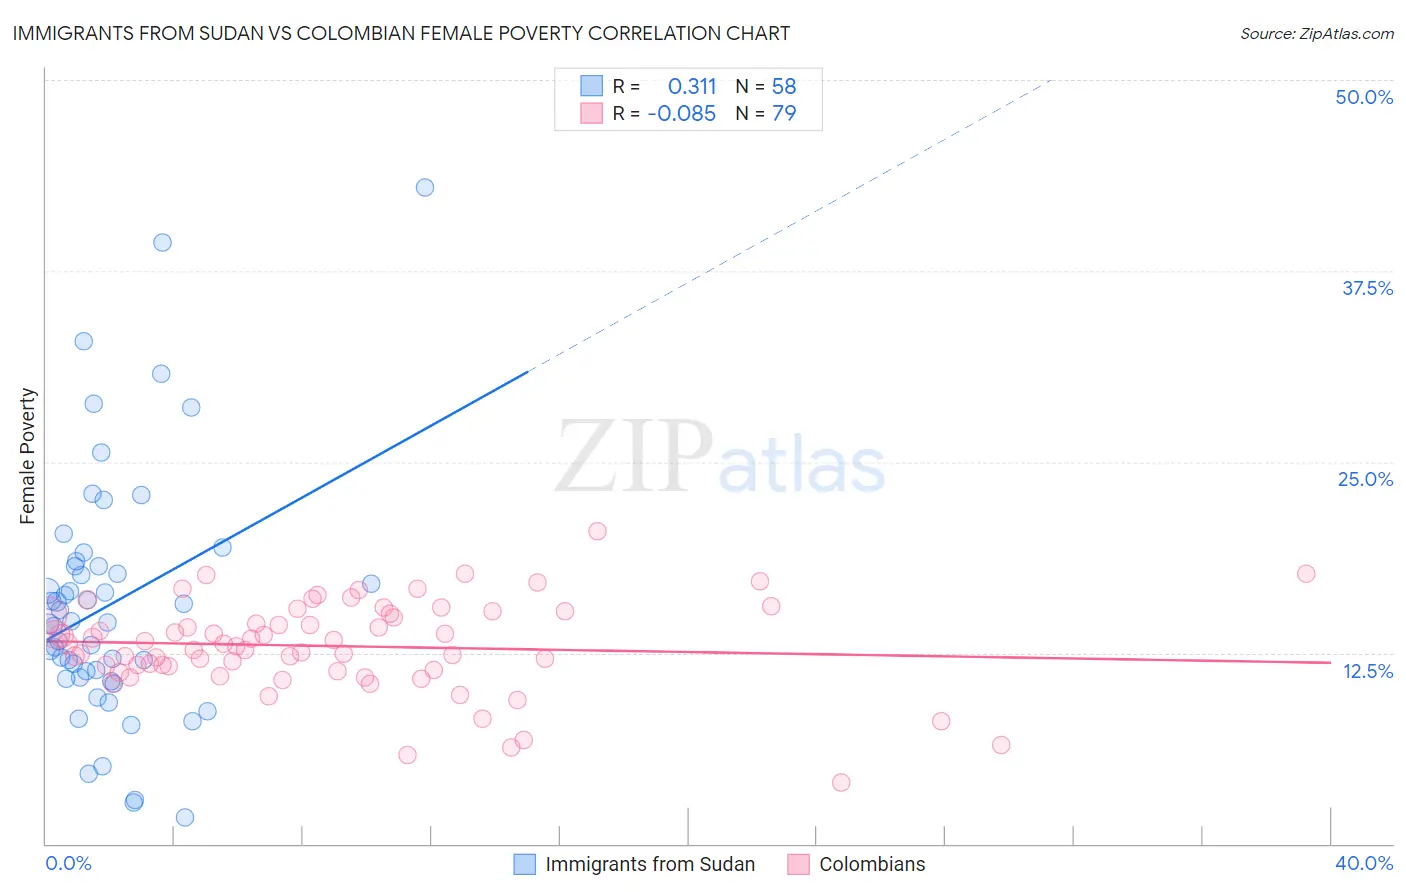
Immigrants from Sudan vs Colombian Female Poverty Correlation Chart
The statistical analysis conducted on geographies consisting of 118,954,745 people shows a mild positive correlation between the proportion of Immigrants from Sudan and poverty level among females in the United States with a correlation coefficient (R) of 0.311 and weighted average of 15.2%. Similarly, the statistical analysis conducted on geographies consisting of 419,235,280 people shows a slight negative correlation between the proportion of Colombians and poverty level among females in the United States with a correlation coefficient (R) of -0.085 and weighted average of 13.4%, a difference of 13.9%.
Female Poverty Correlation Summary
| Measurement | Immigrants from Sudan | Colombian |
| Minimum | 1.7% | 4.0% |
| Maximum | 43.0% | 20.5% |
| Range | 41.3% | 16.5% |
| Mean | 15.7% | 12.9% |
| Median | 14.5% | 13.1% |
| Interquartile 25% (IQ1) | 10.9% | 11.4% |
| Interquartile 75% (IQ3) | 18.2% | 15.1% |
| Interquartile Range (IQR) | 7.3% | 3.7% |
| Standard Deviation (Sample) | 8.2% | 3.0% |
| Standard Deviation (Population) | 8.1% | 3.0% |
Similar Demographics by Female Poverty
Demographics Similar to Immigrants from Sudan by Female Poverty
In terms of female poverty, the demographic groups most similar to Immigrants from Sudan are Nepalese (15.2%, a difference of 0.12%), Sudanese (15.2%, a difference of 0.25%), Immigrants from Middle Africa (15.2%, a difference of 0.30%), Nicaraguan (15.3%, a difference of 0.36%), and Ecuadorian (15.3%, a difference of 0.41%).
| Demographics | Rating | Rank | Female Poverty |
| Fijians | 1.1 /100 | #234 | Tragic 14.9% |
| Immigrants | Laos | 0.9 /100 | #235 | Tragic 15.0% |
| Cree | 0.7 /100 | #236 | Tragic 15.1% |
| French American Indians | 0.6 /100 | #237 | Tragic 15.1% |
| Immigrants | Armenia | 0.6 /100 | #238 | Tragic 15.1% |
| Immigrants | Middle Africa | 0.5 /100 | #239 | Tragic 15.2% |
| Sudanese | 0.5 /100 | #240 | Tragic 15.2% |
| Immigrants | Sudan | 0.4 /100 | #241 | Tragic 15.2% |
| Nepalese | 0.4 /100 | #242 | Tragic 15.2% |
| Nicaraguans | 0.3 /100 | #243 | Tragic 15.3% |
| Ecuadorians | 0.3 /100 | #244 | Tragic 15.3% |
| Spanish American Indians | 0.3 /100 | #245 | Tragic 15.3% |
| Cubans | 0.3 /100 | #246 | Tragic 15.3% |
| Potawatomi | 0.3 /100 | #247 | Tragic 15.3% |
| Immigrants | Ghana | 0.3 /100 | #248 | Tragic 15.3% |
Demographics Similar to Colombians by Female Poverty
In terms of female poverty, the demographic groups most similar to Colombians are Lebanese (13.4%, a difference of 0.020%), Aleut (13.4%, a difference of 0.10%), White/Caucasian (13.4%, a difference of 0.11%), Immigrants from Chile (13.3%, a difference of 0.16%), and Mongolian (13.4%, a difference of 0.21%).
| Demographics | Rating | Rank | Female Poverty |
| Immigrants | Albania | 62.4 /100 | #163 | Good 13.3% |
| Ethiopians | 62.3 /100 | #164 | Good 13.3% |
| Scotch-Irish | 62.1 /100 | #165 | Good 13.3% |
| Immigrants | Oceania | 59.7 /100 | #166 | Average 13.3% |
| Immigrants | Chile | 57.4 /100 | #167 | Average 13.3% |
| Aleuts | 56.7 /100 | #168 | Average 13.4% |
| Lebanese | 55.9 /100 | #169 | Average 13.4% |
| Colombians | 55.7 /100 | #170 | Average 13.4% |
| Whites/Caucasians | 54.6 /100 | #171 | Average 13.4% |
| Mongolians | 53.6 /100 | #172 | Average 13.4% |
| Immigrants | Afghanistan | 50.8 /100 | #173 | Average 13.4% |
| Immigrants | Iraq | 50.0 /100 | #174 | Average 13.4% |
| Celtics | 49.9 /100 | #175 | Average 13.4% |
| Immigrants | Spain | 49.9 /100 | #176 | Average 13.4% |
| Immigrants | Morocco | 49.4 /100 | #177 | Average 13.4% |