Immigrants from Spain vs Turkish Female Poverty Among 25-34 Year Olds
COMPARE
Immigrants from Spain
Turkish
Female Poverty Among 25-34 Year Olds
Female Poverty Among 25-34 Year Olds Comparison
Immigrants from Spain
Turks
12.7%
FEMALE POVERTY AMONG 25-34 YEAR OLDS
95.5/ 100
METRIC RATING
103rd/ 347
METRIC RANK
11.4%
FEMALE POVERTY AMONG 25-34 YEAR OLDS
100.0/ 100
METRIC RATING
21st/ 347
METRIC RANK
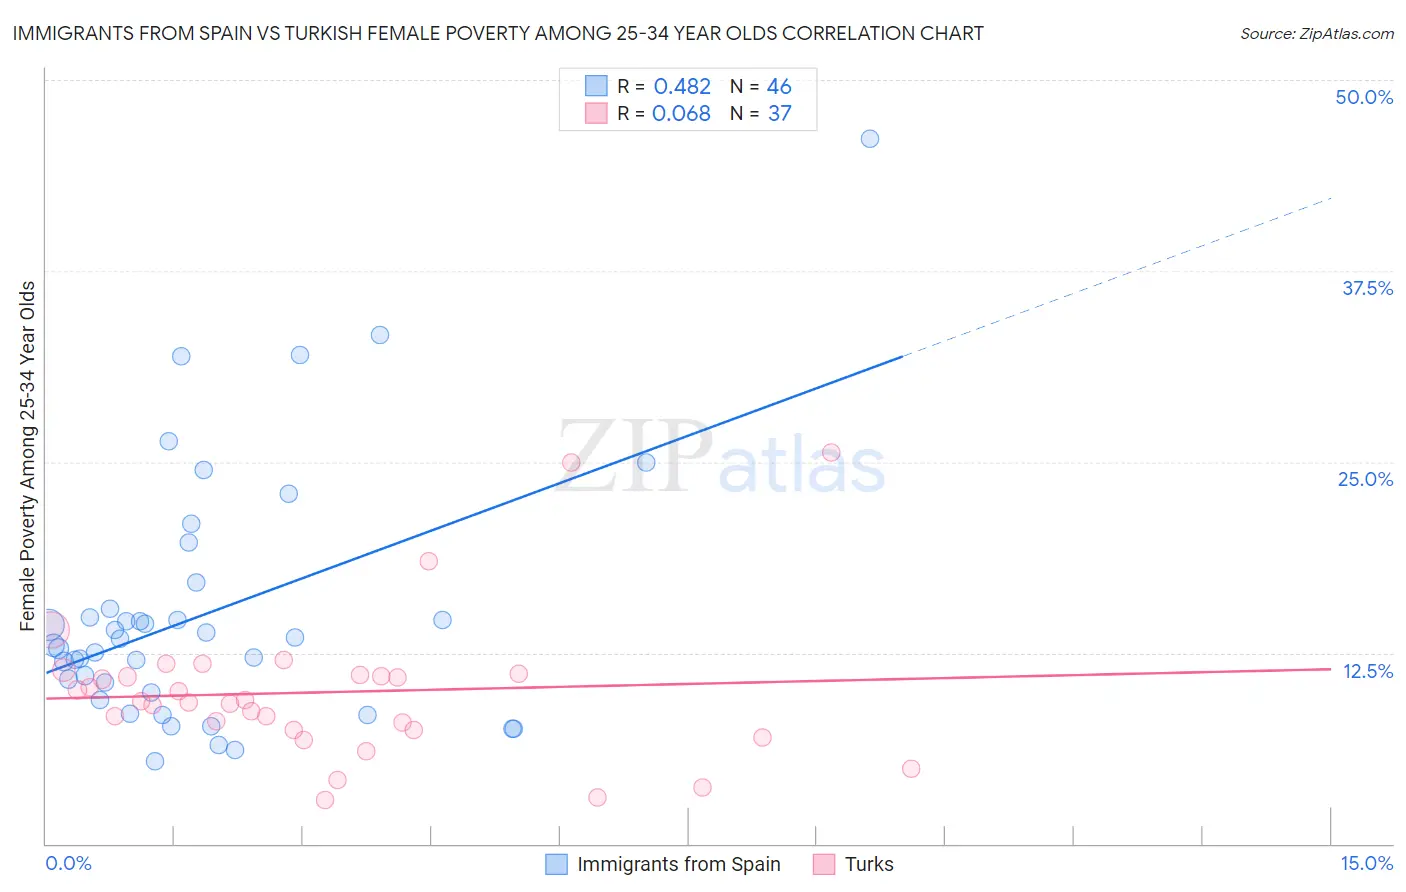
Immigrants from Spain vs Turkish Female Poverty Among 25-34 Year Olds Correlation Chart
The statistical analysis conducted on geographies consisting of 237,358,886 people shows a moderate positive correlation between the proportion of Immigrants from Spain and poverty level among females between the ages 25 and 34 in the United States with a correlation coefficient (R) of 0.482 and weighted average of 12.7%. Similarly, the statistical analysis conducted on geographies consisting of 268,457,776 people shows a slight positive correlation between the proportion of Turks and poverty level among females between the ages 25 and 34 in the United States with a correlation coefficient (R) of 0.068 and weighted average of 11.4%, a difference of 11.3%.
Female Poverty Among 25-34 Year Olds Correlation Summary
| Measurement | Immigrants from Spain | Turkish |
| Minimum | 5.4% | 2.8% |
| Maximum | 46.2% | 25.6% |
| Range | 40.7% | 22.8% |
| Mean | 15.1% | 9.9% |
| Median | 13.2% | 9.3% |
| Interquartile 25% (IQ1) | 9.9% | 7.5% |
| Interquartile 75% (IQ3) | 15.4% | 11.1% |
| Interquartile Range (IQR) | 5.5% | 3.6% |
| Standard Deviation (Sample) | 8.3% | 4.8% |
| Standard Deviation (Population) | 8.2% | 4.8% |
Similar Demographics by Female Poverty Among 25-34 Year Olds
Demographics Similar to Immigrants from Spain by Female Poverty Among 25-34 Year Olds
In terms of female poverty among 25-34 year olds, the demographic groups most similar to Immigrants from Spain are Swedish (12.7%, a difference of 0.050%), Peruvian (12.7%, a difference of 0.060%), Immigrants from South Africa (12.7%, a difference of 0.090%), Immigrants from Switzerland (12.7%, a difference of 0.12%), and Immigrants from Denmark (12.7%, a difference of 0.14%).
| Demographics | Rating | Rank | Female Poverty Among 25-34 Year Olds |
| Immigrants | Zimbabwe | 96.7 /100 | #96 | Exceptional 12.6% |
| Immigrants | Northern Africa | 96.6 /100 | #97 | Exceptional 12.6% |
| Immigrants | Ethiopia | 96.5 /100 | #98 | Exceptional 12.6% |
| Immigrants | Argentina | 96.4 /100 | #99 | Exceptional 12.6% |
| Immigrants | Denmark | 95.7 /100 | #100 | Exceptional 12.7% |
| Immigrants | Switzerland | 95.7 /100 | #101 | Exceptional 12.7% |
| Peruvians | 95.6 /100 | #102 | Exceptional 12.7% |
| Immigrants | Spain | 95.5 /100 | #103 | Exceptional 12.7% |
| Swedes | 95.4 /100 | #104 | Exceptional 12.7% |
| Immigrants | South Africa | 95.3 /100 | #105 | Exceptional 12.7% |
| Tsimshian | 95.1 /100 | #106 | Exceptional 12.7% |
| Poles | 94.9 /100 | #107 | Exceptional 12.7% |
| Immigrants | Norway | 94.4 /100 | #108 | Exceptional 12.7% |
| Immigrants | Peru | 94.3 /100 | #109 | Exceptional 12.7% |
| Australians | 94.1 /100 | #110 | Exceptional 12.8% |
Demographics Similar to Turks by Female Poverty Among 25-34 Year Olds
In terms of female poverty among 25-34 year olds, the demographic groups most similar to Turks are Asian (11.4%, a difference of 0.15%), Bolivian (11.4%, a difference of 0.21%), Maltese (11.4%, a difference of 0.24%), Bhutanese (11.4%, a difference of 0.46%), and Tongan (11.5%, a difference of 0.61%).
| Demographics | Rating | Rank | Female Poverty Among 25-34 Year Olds |
| Indians (Asian) | 100.0 /100 | #14 | Exceptional 11.2% |
| Assyrians/Chaldeans/Syriacs | 100.0 /100 | #15 | Exceptional 11.2% |
| Immigrants | Bolivia | 100.0 /100 | #16 | Exceptional 11.2% |
| Immigrants | China | 100.0 /100 | #17 | Exceptional 11.2% |
| Immigrants | Eastern Asia | 100.0 /100 | #18 | Exceptional 11.2% |
| Iranians | 100.0 /100 | #19 | Exceptional 11.2% |
| Okinawans | 100.0 /100 | #20 | Exceptional 11.3% |
| Turks | 100.0 /100 | #21 | Exceptional 11.4% |
| Asians | 99.9 /100 | #22 | Exceptional 11.4% |
| Bolivians | 99.9 /100 | #23 | Exceptional 11.4% |
| Maltese | 99.9 /100 | #24 | Exceptional 11.4% |
| Bhutanese | 99.9 /100 | #25 | Exceptional 11.4% |
| Tongans | 99.9 /100 | #26 | Exceptional 11.5% |
| Immigrants | Greece | 99.9 /100 | #27 | Exceptional 11.5% |
| Immigrants | Pakistan | 99.9 /100 | #28 | Exceptional 11.5% |