Immigrants from Spain vs Nigerian Single Male Poverty
COMPARE
Immigrants from Spain
Nigerian
Single Male Poverty
Single Male Poverty Comparison
Immigrants from Spain
Nigerians
12.7%
SINGLE MALE POVERTY
68.7/ 100
METRIC RATING
155th/ 347
METRIC RANK
12.9%
SINGLE MALE POVERTY
31.9/ 100
METRIC RATING
186th/ 347
METRIC RANK
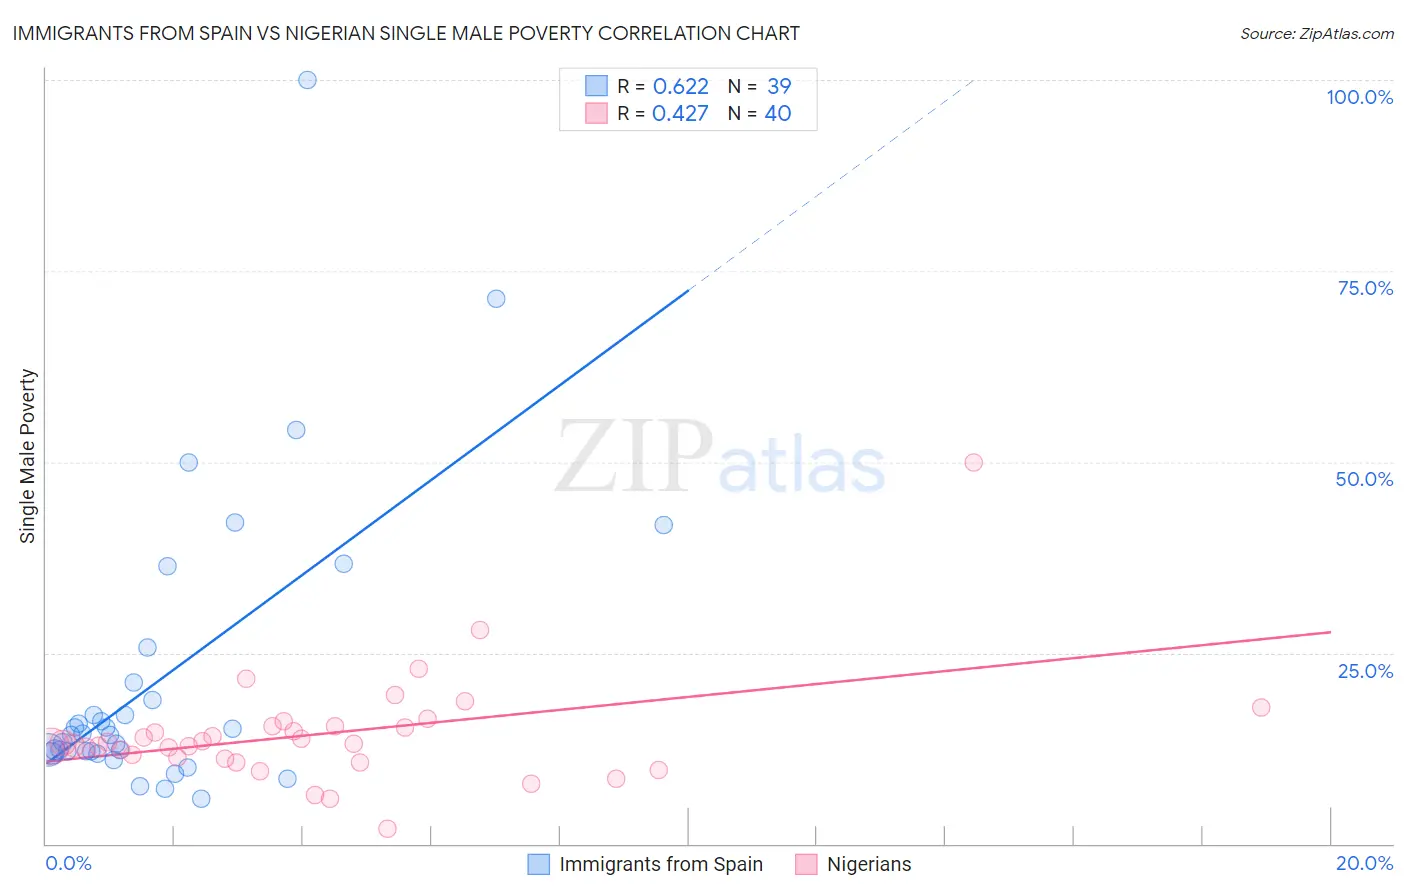
Immigrants from Spain vs Nigerian Single Male Poverty Correlation Chart
The statistical analysis conducted on geographies consisting of 219,998,655 people shows a significant positive correlation between the proportion of Immigrants from Spain and poverty level among single males in the United States with a correlation coefficient (R) of 0.622 and weighted average of 12.7%. Similarly, the statistical analysis conducted on geographies consisting of 304,027,429 people shows a moderate positive correlation between the proportion of Nigerians and poverty level among single males in the United States with a correlation coefficient (R) of 0.427 and weighted average of 12.9%, a difference of 2.1%.
Single Male Poverty Correlation Summary
| Measurement | Immigrants from Spain | Nigerian |
| Minimum | 5.9% | 1.9% |
| Maximum | 100.0% | 50.0% |
| Range | 94.1% | 48.1% |
| Mean | 21.7% | 14.4% |
| Median | 14.2% | 13.2% |
| Interquartile 25% (IQ1) | 12.1% | 11.2% |
| Interquartile 75% (IQ3) | 21.0% | 15.4% |
| Interquartile Range (IQR) | 9.0% | 4.2% |
| Standard Deviation (Sample) | 19.4% | 7.4% |
| Standard Deviation (Population) | 19.2% | 7.3% |
Similar Demographics by Single Male Poverty
Demographics Similar to Immigrants from Spain by Single Male Poverty
In terms of single male poverty, the demographic groups most similar to Immigrants from Spain are Immigrants from Scotland (12.7%, a difference of 0.020%), Vietnamese (12.7%, a difference of 0.040%), Latvian (12.7%, a difference of 0.040%), Immigrants (12.7%, a difference of 0.090%), and Australian (12.6%, a difference of 0.17%).
| Demographics | Rating | Rank | Single Male Poverty |
| Yugoslavians | 73.9 /100 | #148 | Good 12.6% |
| Sierra Leoneans | 73.0 /100 | #149 | Good 12.6% |
| Immigrants | Panama | 72.1 /100 | #150 | Good 12.6% |
| Immigrants | Hungary | 71.9 /100 | #151 | Good 12.6% |
| Australians | 71.4 /100 | #152 | Good 12.6% |
| Immigrants | Immigrants | 70.1 /100 | #153 | Good 12.7% |
| Immigrants | Scotland | 68.9 /100 | #154 | Good 12.7% |
| Immigrants | Spain | 68.7 /100 | #155 | Good 12.7% |
| Vietnamese | 67.9 /100 | #156 | Good 12.7% |
| Latvians | 67.9 /100 | #157 | Good 12.7% |
| Immigrants | Middle Africa | 64.9 /100 | #158 | Good 12.7% |
| Immigrants | Liberia | 64.2 /100 | #159 | Good 12.7% |
| Greeks | 64.1 /100 | #160 | Good 12.7% |
| Immigrants | Africa | 63.4 /100 | #161 | Good 12.7% |
| Eastern Europeans | 63.3 /100 | #162 | Good 12.7% |
Demographics Similar to Nigerians by Single Male Poverty
In terms of single male poverty, the demographic groups most similar to Nigerians are Norwegian (12.9%, a difference of 0.0%), Immigrants from Kuwait (12.9%, a difference of 0.0%), Immigrants from Trinidad and Tobago (12.9%, a difference of 0.030%), Macedonian (12.9%, a difference of 0.030%), and Immigrants from West Indies (12.9%, a difference of 0.060%).
| Demographics | Rating | Rank | Single Male Poverty |
| Israelis | 41.0 /100 | #179 | Average 12.9% |
| Immigrants | North America | 37.7 /100 | #180 | Fair 12.9% |
| Panamanians | 37.6 /100 | #181 | Fair 12.9% |
| Moroccans | 36.8 /100 | #182 | Fair 12.9% |
| Immigrants | West Indies | 33.0 /100 | #183 | Fair 12.9% |
| Immigrants | Trinidad and Tobago | 32.5 /100 | #184 | Fair 12.9% |
| Norwegians | 32.0 /100 | #185 | Fair 12.9% |
| Nigerians | 31.9 /100 | #186 | Fair 12.9% |
| Immigrants | Kuwait | 31.9 /100 | #187 | Fair 12.9% |
| Macedonians | 31.5 /100 | #188 | Fair 12.9% |
| Portuguese | 30.2 /100 | #189 | Fair 12.9% |
| Arabs | 27.0 /100 | #190 | Fair 13.0% |
| Immigrants | Thailand | 26.6 /100 | #191 | Fair 13.0% |
| Immigrants | Jamaica | 26.5 /100 | #192 | Fair 13.0% |
| Immigrants | South Africa | 26.1 /100 | #193 | Fair 13.0% |