Immigrants from South Central Asia vs Yakama Family Poverty
COMPARE
Immigrants from South Central Asia
Yakama
Family Poverty
Family Poverty Comparison
Immigrants from South Central Asia
Yakama
7.2%
FAMILY POVERTY
99.8/ 100
METRIC RATING
16th/ 347
METRIC RANK
13.1%
FAMILY POVERTY
0.0/ 100
METRIC RATING
327th/ 347
METRIC RANK
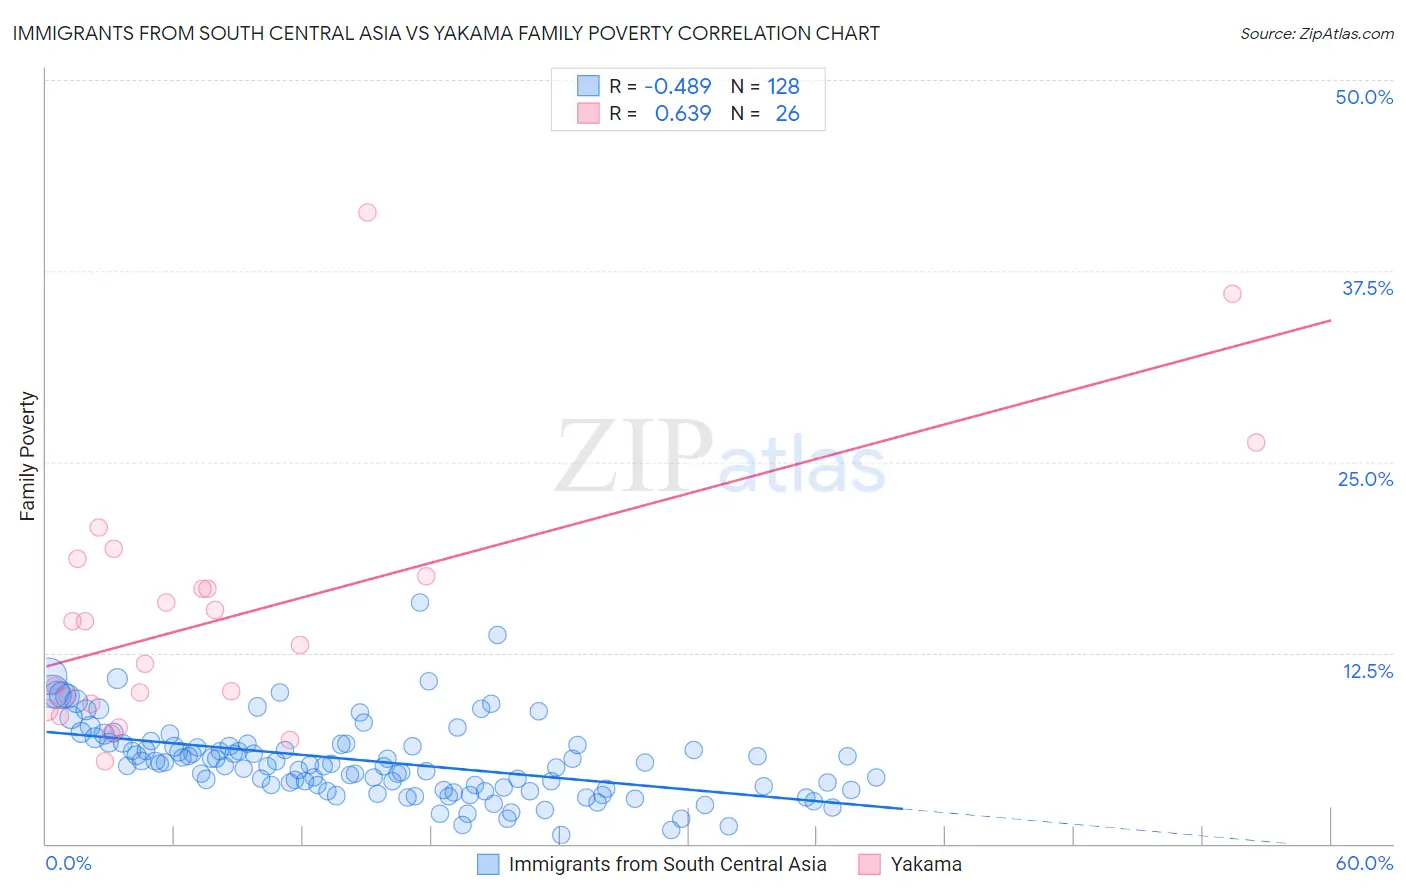
Immigrants from South Central Asia vs Yakama Family Poverty Correlation Chart
The statistical analysis conducted on geographies consisting of 471,025,257 people shows a moderate negative correlation between the proportion of Immigrants from South Central Asia and poverty level among families in the United States with a correlation coefficient (R) of -0.489 and weighted average of 7.2%. Similarly, the statistical analysis conducted on geographies consisting of 19,913,351 people shows a significant positive correlation between the proportion of Yakama and poverty level among families in the United States with a correlation coefficient (R) of 0.639 and weighted average of 13.1%, a difference of 81.7%.
Family Poverty Correlation Summary
| Measurement | Immigrants from South Central Asia | Yakama |
| Minimum | 0.60% | 5.4% |
| Maximum | 15.8% | 41.3% |
| Range | 15.2% | 35.9% |
| Mean | 5.4% | 15.1% |
| Median | 5.2% | 13.8% |
| Interquartile 25% (IQ1) | 3.7% | 9.1% |
| Interquartile 75% (IQ3) | 6.5% | 17.5% |
| Interquartile Range (IQR) | 2.9% | 8.4% |
| Standard Deviation (Sample) | 2.5% | 8.6% |
| Standard Deviation (Population) | 2.5% | 8.4% |
Similar Demographics by Family Poverty
Demographics Similar to Immigrants from South Central Asia by Family Poverty
In terms of family poverty, the demographic groups most similar to Immigrants from South Central Asia are Luxembourger (7.2%, a difference of 0.22%), Immigrants from Lithuania (7.2%, a difference of 0.24%), Lithuanian (7.2%, a difference of 0.27%), Eastern European (7.2%, a difference of 0.54%), and Immigrants from Hong Kong (7.3%, a difference of 0.70%).
| Demographics | Rating | Rank | Family Poverty |
| Latvians | 99.9 /100 | #9 | Exceptional 7.1% |
| Bulgarians | 99.8 /100 | #10 | Exceptional 7.1% |
| Immigrants | Singapore | 99.8 /100 | #11 | Exceptional 7.1% |
| Maltese | 99.8 /100 | #12 | Exceptional 7.1% |
| Swedes | 99.8 /100 | #13 | Exceptional 7.1% |
| Iranians | 99.8 /100 | #14 | Exceptional 7.1% |
| Lithuanians | 99.8 /100 | #15 | Exceptional 7.2% |
| Immigrants | South Central Asia | 99.8 /100 | #16 | Exceptional 7.2% |
| Luxembourgers | 99.8 /100 | #17 | Exceptional 7.2% |
| Immigrants | Lithuania | 99.8 /100 | #18 | Exceptional 7.2% |
| Eastern Europeans | 99.7 /100 | #19 | Exceptional 7.2% |
| Immigrants | Hong Kong | 99.7 /100 | #20 | Exceptional 7.3% |
| Immigrants | Iran | 99.7 /100 | #21 | Exceptional 7.3% |
| Danes | 99.7 /100 | #22 | Exceptional 7.3% |
| Assyrians/Chaldeans/Syriacs | 99.7 /100 | #23 | Exceptional 7.3% |
Demographics Similar to Yakama by Family Poverty
In terms of family poverty, the demographic groups most similar to Yakama are Colville (13.0%, a difference of 0.68%), Paiute (13.0%, a difference of 0.75%), Central American Indian (13.3%, a difference of 1.7%), Black/African American (13.3%, a difference of 1.8%), and Immigrants from Dominica (12.7%, a difference of 2.7%).
| Demographics | Rating | Rank | Family Poverty |
| Inupiat | 0.0 /100 | #320 | Tragic 12.5% |
| Arapaho | 0.0 /100 | #321 | Tragic 12.7% |
| Immigrants | Honduras | 0.0 /100 | #322 | Tragic 12.7% |
| Menominee | 0.0 /100 | #323 | Tragic 12.7% |
| Immigrants | Dominica | 0.0 /100 | #324 | Tragic 12.7% |
| Paiute | 0.0 /100 | #325 | Tragic 13.0% |
| Colville | 0.0 /100 | #326 | Tragic 13.0% |
| Yakama | 0.0 /100 | #327 | Tragic 13.1% |
| Central American Indians | 0.0 /100 | #328 | Tragic 13.3% |
| Blacks/African Americans | 0.0 /100 | #329 | Tragic 13.3% |
| Natives/Alaskans | 0.0 /100 | #330 | Tragic 14.3% |
| Cheyenne | 0.0 /100 | #331 | Tragic 14.3% |
| Dominicans | 0.0 /100 | #332 | Tragic 14.3% |
| Immigrants | Dominican Republic | 0.0 /100 | #333 | Tragic 14.4% |
| Houma | 0.0 /100 | #334 | Tragic 14.6% |