Immigrants from South America vs Inupiat Family Poverty

COMPARE

Immigrants from South America
Race
Ancestry
AfghanAfricanAlaska NativeAlaskan AthabascanAlbanianAleutAlsatianAmericanApacheArabArapahoArgentineanArmenianAssyrian/Chaldean/SyriacAustralianAustrianBahamianBangladeshiBarbadianBasqueBelgianBelizeanBermudanBhutaneseBlackfeetBolivianBrazilianBritishBritish West IndianBulgarianBurmeseCajunCambodianCanadianCape VerdeanCarpatho RusynCelticCentral AmericanCentral American IndianCherokeeCheyenneChickasawChileanChineseChippewaChoctawColombianColvilleComancheCosta RicanCreeCreekCroatianCrowCubanCypriotCzechCzechoslovakianDanishDelawareDominicanDutchDutch West IndianEastern EuropeanEcuadorianEgyptianEnglishEstonianEthiopianEuropeanFijianFilipinoFinnishFrenchFrench American IndianFrench CanadianGermanGerman RussianGhanaianGreekGuamanian/ChamorroGuatemalanGuyaneseHaitianHmongHonduranHopiHoumaHungarianIcelanderIndian (Asian)IndonesianIranianIraqiIrishIroquoisIsraeliItalianJamaicanJapaneseJordanianKenyanKiowaKoreanLaotianLatvianLebaneseLiberianLithuanianLumbeeLuxembourgerMacedonianMalaysianMalteseMarshalleseMenomineeMexicanMexican American IndianMongolianMoroccanNative HawaiianNavajoNepaleseNew ZealanderNicaraguanNigerianNorthern EuropeanNorwegianOkinawanOsageOttawaPaiutePakistaniPalestinianPanamanianParaguayanPennsylvania GermanPeruvianPimaPolishPortuguesePotawatomiPuebloPuerto RicanPuget Sound SalishRomanianRussianSalvadoranSamoanScandinavianScotch-IrishScottishSeminoleSenegaleseSerbianShoshoneSierra LeoneanSiouxSlavicSlovakSloveneSomaliSouth AfricanSouth AmericanSouth American IndianSoviet UnionSpaniardSpanishSpanish AmericanSpanish American IndianSri LankanSubsaharan AfricanSudaneseSwedishSwissSyrianTaiwaneseThaiTlingit-HaidaTohono O'OdhamTonganTrinidadian and TobagonianTsimshianTurkishU.S. Virgin IslanderUgandanUkrainianUruguayanUteVenezuelanVietnameseWelshWest IndianYakamaYaquiYugoslavianYumanYup'ikZimbabwean
Immigration
NonimmigrantsImmigrantsAfghanistanAfricaAlbaniaArgentinaArmeniaAsiaAustraliaAustriaBahamasBangladeshBarbadosBelarusBelgiumBelizeBoliviaBosnia and HerzegovinaBrazilBulgariaBurma/MyanmarCabo VerdeCambodiaCameroonCanadaCaribbeanCentral AmericaChileChinaColombiaCongoCosta RicaCroatiaCubaCzechoslovakiaDenmarkDominicaDominican RepublicEastern AfricaEastern AsiaEastern EuropeEcuadorEgyptEl SalvadorEnglandEritreaEthiopiaEuropeFijiFranceGermanyGhanaGreeceGrenadaGuatemalaGuyanaHaitiHondurasHong KongHungaryIndiaIndonesiaIranIraqIrelandIsraelItalyJamaicaJapanJordanKazakhstanKenyaKoreaKuwaitLaosLatin AmericaLatviaLebanonLiberiaLithuaniaMalaysiaMexicoMicronesiaMiddle AfricaMoldovaMoroccoNepalNetherlandsNicaraguaNigeriaNorth AmericaNorth MacedoniaNorthern AfricaNorthern EuropeNorwayOceaniaPakistanPanamaPeruPhilippinesPolandPortugalRomaniaRussiaSaudi ArabiaScotlandSenegalSerbiaSierra LeoneSingaporeSomaliaSouth AfricaSouth AmericaSouth Central AsiaSouth Eastern AsiaSouthern EuropeSpainSri LankaSt. Vincent and the GrenadinesSudanSwedenSwitzerlandSyriaTaiwanThailandTrinidad and TobagoTurkeyUgandaUkraineUruguayUzbekistanVenezuelaVietnamWest IndiesWestern AfricaWestern AsiaWestern EuropeYemenZaireZimbabweAzores
Inupiat
Race
Ancestry
AfghanAfricanAlaska NativeAlaskan AthabascanAlbanianAleutAlsatianAmericanApacheArabArapahoArgentineanArmenianAssyrian/Chaldean/SyriacAustralianAustrianBahamianBangladeshiBarbadianBasqueBelgianBelizeanBermudanBhutaneseBlackfeetBolivianBrazilianBritishBritish West IndianBulgarianBurmeseCajunCambodianCanadianCape VerdeanCarpatho RusynCelticCentral AmericanCentral American IndianCherokeeCheyenneChickasawChileanChineseChippewaChoctawColombianColvilleComancheCosta RicanCreeCreekCroatianCrowCubanCypriotCzechCzechoslovakianDanishDelawareDominicanDutchDutch West IndianEastern EuropeanEcuadorianEgyptianEnglishEstonianEthiopianEuropeanFijianFilipinoFinnishFrenchFrench American IndianFrench CanadianGermanGerman RussianGhanaianGreekGuamanian/ChamorroGuatemalanGuyaneseHaitianHmongHonduranHopiHoumaHungarianIcelanderIndian (Asian)IndonesianInupiatIranianIraqiIrishIroquoisIsraeliItalianJamaicanJapaneseJordanianKenyanKiowaKoreanLaotianLatvianLebaneseLiberianLithuanianLumbeeLuxembourgerMacedonianMalaysianMalteseMarshalleseMenomineeMexicanMexican American IndianMongolianMoroccanNative HawaiianNavajoNepaleseNew ZealanderNicaraguanNigerianNorthern EuropeanNorwegianOkinawanOsageOttawaPaiutePakistaniPalestinianPanamanianParaguayanPennsylvania GermanPeruvianPimaPolishPortuguesePotawatomiPuebloPuerto RicanPuget Sound SalishRomanianRussianSalvadoranSamoanScandinavianScotch-IrishScottishSeminoleSenegaleseSerbianShoshoneSierra LeoneanSiouxSlavicSlovakSloveneSomaliSouth AfricanSouth AmericanSouth American IndianSoviet UnionSpaniardSpanishSpanish AmericanSpanish American IndianSri LankanSubsaharan AfricanSudaneseSwedishSwissSyrianTaiwaneseThaiTlingit-HaidaTohono O'OdhamTonganTrinidadian and TobagonianTsimshianTurkishU.S. Virgin IslanderUgandanUkrainianUruguayanUteVenezuelanVietnameseWelshWest IndianYakamaYaquiYugoslavianYumanYup'ikZimbabwean
Immigration
NonimmigrantsImmigrantsAfghanistanAfricaAlbaniaArgentinaArmeniaAsiaAustraliaAustriaBahamasBangladeshBarbadosBelarusBelgiumBelizeBoliviaBosnia and HerzegovinaBrazilBulgariaBurma/MyanmarCabo VerdeCambodiaCameroonCanadaCaribbeanCentral AmericaChileChinaColombiaCongoCosta RicaCroatiaCubaCzechoslovakiaDenmarkDominicaDominican RepublicEastern AfricaEastern AsiaEastern EuropeEcuadorEgyptEl SalvadorEnglandEritreaEthiopiaEuropeFijiFranceGermanyGhanaGreeceGrenadaGuatemalaGuyanaHaitiHondurasHong KongHungaryIndiaIndonesiaIranIraqIrelandIsraelItalyJamaicaJapanJordanKazakhstanKenyaKoreaKuwaitLaosLatin AmericaLatviaLebanonLiberiaLithuaniaMalaysiaMexicoMicronesiaMiddle AfricaMoldovaMoroccoNepalNetherlandsNicaraguaNigeriaNorth AmericaNorth MacedoniaNorthern AfricaNorthern EuropeNorwayOceaniaPakistanPanamaPeruPhilippinesPolandPortugalRomaniaRussiaSaudi ArabiaScotlandSenegalSerbiaSierra LeoneSingaporeSomaliaSouth AfricaSouth Central AsiaSouth Eastern AsiaSouthern EuropeSpainSri LankaSt. Vincent and the GrenadinesSudanSwedenSwitzerlandSyriaTaiwanThailandTrinidad and TobagoTurkeyUgandaUkraineUruguayUzbekistanVenezuelaVietnamWest IndiesWestern AfricaWestern AsiaWestern EuropeYemenZaireZimbabweAzores
Family Poverty
Income
Poverty
Unemployment
Labor Participation
Family Structure
Vehicle Availability
Education Level
Disability

Family Poverty Comparison

Immigrants from South America

Inupiat

Poor
Tragic
9.5%
FAMILY POVERTY
18.0/ 100
METRIC RATING
206th/ 347
METRIC RANK
12.5%
FAMILY POVERTY
0.0/ 100
METRIC RATING
320th/ 347
METRIC RANK

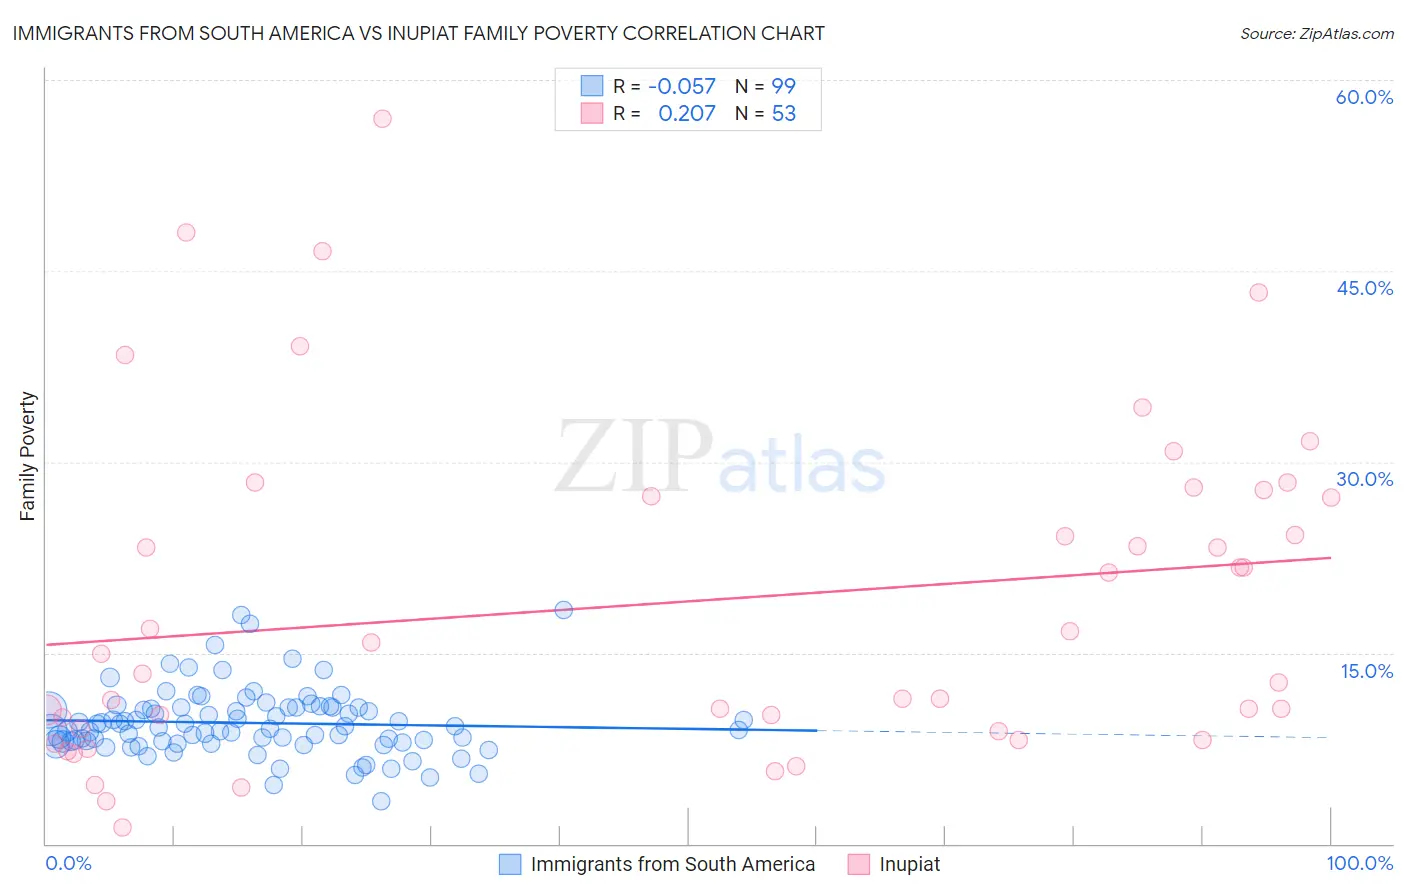
Immigrants from South America vs Inupiat Family Poverty Correlation Chart

The statistical analysis conducted on geographies consisting of 484,267,691 people shows a slight negative correlation between the proportion of Immigrants from South America and poverty level among families in the United States with a correlation coefficient (R) of -0.057 and weighted average of 9.5%. Similarly, the statistical analysis conducted on geographies consisting of 96,272,852 people shows a weak positive correlation between the proportion of Inupiat and poverty level among families in the United States with a correlation coefficient (R) of 0.207 and weighted average of 12.5%, a difference of 31.8%.
Immigrants from South America vs Inupiat Family Poverty

Family Poverty Correlation Summary

MeasurementImmigrants from South AmericaInupiat
Minimum3.3%1.3%
Maximum18.4%56.9%
Range15.1%55.6%
Mean9.5%19.0%
Median9.1%14.9%
Interquartile 25% (IQ1)8.0%8.9%
Interquartile 75% (IQ3)10.7%27.5%
Interquartile Range (IQR)2.7%18.6%
Standard Deviation (Sample)2.6%12.9%
Standard Deviation (Population)2.6%12.8%

Similar Demographics by Family Poverty

Demographics Similar to Immigrants from South America by Family Poverty

In terms of family poverty, the demographic groups most similar to Immigrants from South America are Aleut (9.5%, a difference of 0.010%), Immigrants from Lebanon (9.4%, a difference of 0.20%), German Russian (9.4%, a difference of 0.30%), Immigrants from Sierra Leone (9.4%, a difference of 0.34%), and Immigrants from Portugal (9.4%, a difference of 0.52%).
DemographicsRating | RankFamily Poverty
Spaniards
22.8
/100
|
#199
Fair
9.4%
Immigrants | Costa Rica
21.7
/100
|
#200
Fair
9.4%
Immigrants | Portugal
20.5
/100
|
#201
Fair
9.4%
Immigrants | Sierra Leone
19.6
/100
|
#202
Poor
9.4%
German Russians
19.4
/100
|
#203
Poor
9.4%
Immigrants | Lebanon
18.9
/100
|
#204
Poor
9.4%
Aleuts
18.0
/100
|
#205
Poor
9.5%
Immigrants | South America
18.0
/100
|
#206
Poor
9.5%
Sierra Leoneans
15.6
/100
|
#207
Poor
9.5%
Immigrants | Eastern Africa
15.1
/100
|
#208
Poor
9.5%
Immigrants | Uruguay
14.0
/100
|
#209
Poor
9.5%
Alsatians
11.3
/100
|
#210
Poor
9.6%
Malaysians
10.6
/100
|
#211
Poor
9.6%
Immigrants | Thailand
9.7
/100
|
#212
Tragic
9.7%
Osage
8.0
/100
|
#213
Tragic
9.7%

Demographics Similar to Inupiat by Family Poverty

In terms of family poverty, the demographic groups most similar to Inupiat are British West Indian (12.4%, a difference of 0.48%), U.S. Virgin Islander (12.4%, a difference of 0.53%), Immigrants from Grenada (12.4%, a difference of 0.54%), Honduran (12.4%, a difference of 0.76%), and Immigrants from Mexico (12.3%, a difference of 1.5%).
DemographicsRating | RankFamily Poverty
Immigrants | Caribbean
0.0
/100
|
#313
Tragic
12.2%
Kiowa
0.0
/100
|
#314
Tragic
12.2%
Immigrants | Mexico
0.0
/100
|
#315
Tragic
12.3%
Hondurans
0.0
/100
|
#316
Tragic
12.4%
Immigrants | Grenada
0.0
/100
|
#317
Tragic
12.4%
U.S. Virgin Islanders
0.0
/100
|
#318
Tragic
12.4%
British West Indians
0.0
/100
|
#319
Tragic
12.4%
Inupiat
0.0
/100
|
#320
Tragic
12.5%
Arapaho
0.0
/100
|
#321
Tragic
12.7%
Immigrants | Honduras
0.0
/100
|
#322
Tragic
12.7%
Menominee
0.0
/100
|
#323
Tragic
12.7%
Immigrants | Dominica
0.0
/100
|
#324
Tragic
12.7%
Paiute
0.0
/100
|
#325
Tragic
13.0%
Colville
0.0
/100
|
#326
Tragic
13.0%
Yakama
0.0
/100
|
#327
Tragic
13.1%