Immigrants from South Africa vs Immigrants from Peru Seniors Poverty Over the Age of 75
COMPARE
Immigrants from South Africa
Immigrants from Peru
Seniors Poverty Over the Age of 75
Seniors Poverty Over the Age of 75 Comparison
Immigrants from South Africa
Immigrants from Peru
11.5%
SENIORS POVERTY OVER THE AGE OF 75
94.9/ 100
METRIC RATING
83rd/ 347
METRIC RANK
13.7%
SENIORS POVERTY OVER THE AGE OF 75
0.3/ 100
METRIC RATING
251st/ 347
METRIC RANK
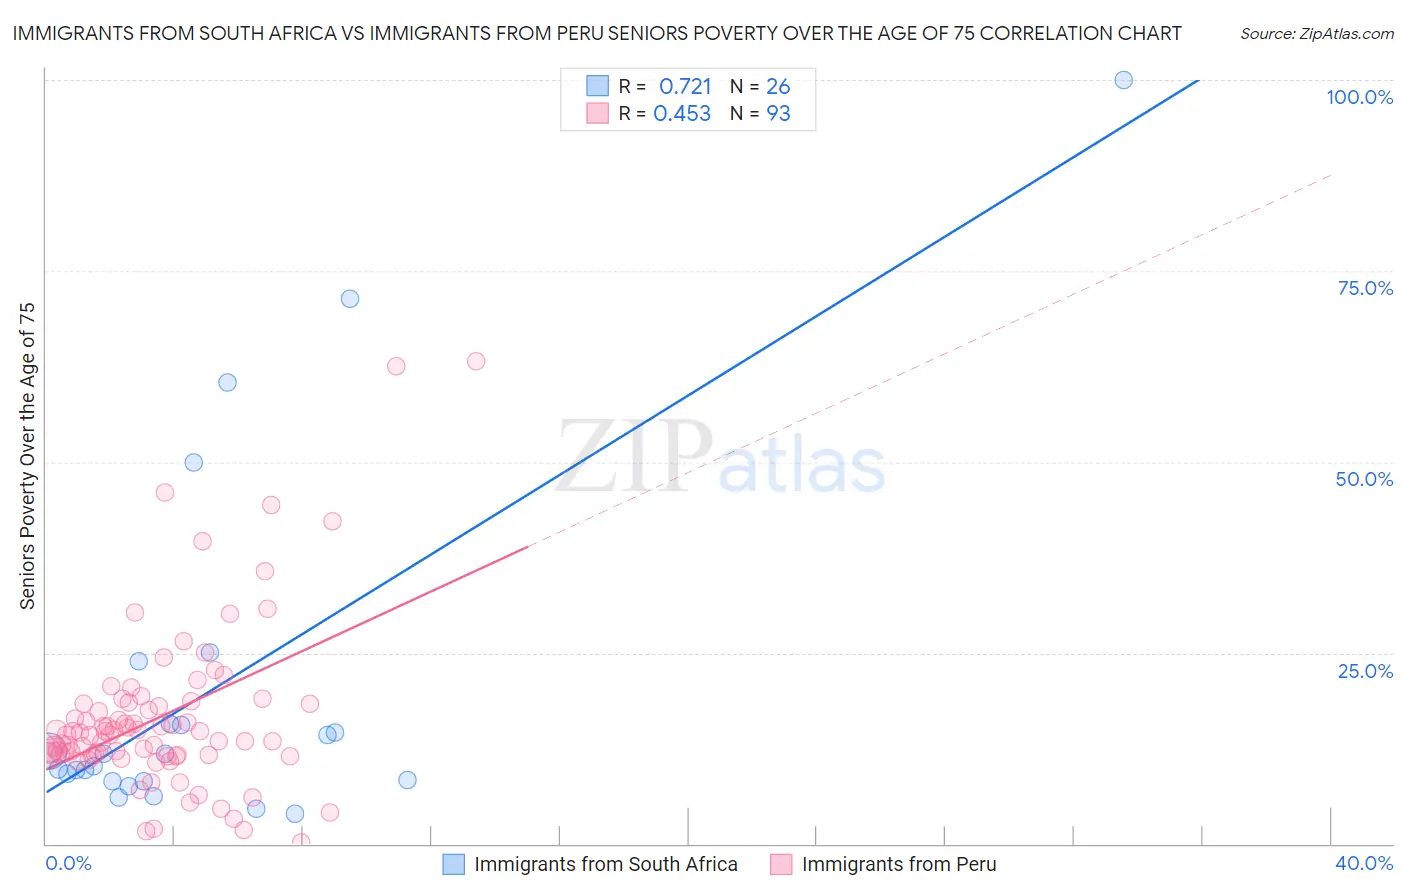
Immigrants from South Africa vs Immigrants from Peru Seniors Poverty Over the Age of 75 Correlation Chart
The statistical analysis conducted on geographies consisting of 231,486,555 people shows a strong positive correlation between the proportion of Immigrants from South Africa and poverty level among seniors over the age of 75 in the United States with a correlation coefficient (R) of 0.721 and weighted average of 11.5%. Similarly, the statistical analysis conducted on geographies consisting of 326,168,143 people shows a moderate positive correlation between the proportion of Immigrants from Peru and poverty level among seniors over the age of 75 in the United States with a correlation coefficient (R) of 0.453 and weighted average of 13.7%, a difference of 19.1%.
Seniors Poverty Over the Age of 75 Correlation Summary
| Measurement | Immigrants from South Africa | Immigrants from Peru |
| Minimum | 4.0% | 0.17% |
| Maximum | 100.0% | 63.2% |
| Range | 96.0% | 63.0% |
| Mean | 20.3% | 16.6% |
| Median | 11.0% | 14.3% |
| Interquartile 25% (IQ1) | 8.3% | 11.6% |
| Interquartile 75% (IQ3) | 15.7% | 18.4% |
| Interquartile Range (IQR) | 7.5% | 6.8% |
| Standard Deviation (Sample) | 23.6% | 11.0% |
| Standard Deviation (Population) | 23.1% | 10.9% |
Similar Demographics by Seniors Poverty Over the Age of 75
Demographics Similar to Immigrants from South Africa by Seniors Poverty Over the Age of 75
In terms of seniors poverty over the age of 75, the demographic groups most similar to Immigrants from South Africa are Immigrants from Iraq (11.5%, a difference of 0.0%), Iranian (11.5%, a difference of 0.080%), Basque (11.5%, a difference of 0.10%), Immigrants from Bulgaria (11.5%, a difference of 0.11%), and Australian (11.5%, a difference of 0.13%).
| Demographics | Rating | Rank | Seniors Poverty Over the Age of 75 |
| French Canadians | 95.7 /100 | #76 | Exceptional 11.4% |
| Whites/Caucasians | 95.5 /100 | #77 | Exceptional 11.4% |
| Macedonians | 95.5 /100 | #78 | Exceptional 11.4% |
| Filipinos | 95.5 /100 | #79 | Exceptional 11.4% |
| Alaska Natives | 95.4 /100 | #80 | Exceptional 11.4% |
| Basques | 95.1 /100 | #81 | Exceptional 11.5% |
| Iranians | 95.1 /100 | #82 | Exceptional 11.5% |
| Immigrants | South Africa | 94.9 /100 | #83 | Exceptional 11.5% |
| Immigrants | Iraq | 94.9 /100 | #84 | Exceptional 11.5% |
| Immigrants | Bulgaria | 94.7 /100 | #85 | Exceptional 11.5% |
| Australians | 94.6 /100 | #86 | Exceptional 11.5% |
| Koreans | 94.5 /100 | #87 | Exceptional 11.5% |
| Immigrants | Croatia | 94.5 /100 | #88 | Exceptional 11.5% |
| Immigrants | Sri Lanka | 94.4 /100 | #89 | Exceptional 11.5% |
| Aleuts | 94.1 /100 | #90 | Exceptional 11.5% |
Demographics Similar to Immigrants from Peru by Seniors Poverty Over the Age of 75
In terms of seniors poverty over the age of 75, the demographic groups most similar to Immigrants from Peru are Immigrants from Argentina (13.7%, a difference of 0.050%), Immigrants from Spain (13.7%, a difference of 0.27%), Mexican American Indian (13.6%, a difference of 0.33%), Immigrants from Albania (13.6%, a difference of 0.34%), and African (13.6%, a difference of 0.35%).
| Demographics | Rating | Rank | Seniors Poverty Over the Age of 75 |
| Spanish Americans | 0.5 /100 | #244 | Tragic 13.5% |
| Uruguayans | 0.5 /100 | #245 | Tragic 13.5% |
| Immigrants | Cambodia | 0.4 /100 | #246 | Tragic 13.6% |
| Immigrants | Ukraine | 0.3 /100 | #247 | Tragic 13.6% |
| Africans | 0.3 /100 | #248 | Tragic 13.6% |
| Immigrants | Albania | 0.3 /100 | #249 | Tragic 13.6% |
| Mexican American Indians | 0.3 /100 | #250 | Tragic 13.6% |
| Immigrants | Peru | 0.3 /100 | #251 | Tragic 13.7% |
| Immigrants | Argentina | 0.3 /100 | #252 | Tragic 13.7% |
| Immigrants | Spain | 0.2 /100 | #253 | Tragic 13.7% |
| Blackfeet | 0.2 /100 | #254 | Tragic 13.7% |
| Immigrants | Belarus | 0.2 /100 | #255 | Tragic 13.8% |
| Inupiat | 0.1 /100 | #256 | Tragic 13.8% |
| Immigrants | Western Africa | 0.1 /100 | #257 | Tragic 13.9% |
| Immigrants | Panama | 0.1 /100 | #258 | Tragic 13.9% |