Immigrants from South Africa vs Immigrants from the Azores Poverty

COMPARE

Immigrants from South Africa
Race
Ancestry
AfghanAfricanAlaska NativeAlaskan AthabascanAlbanianAleutAlsatianAmericanApacheArabArapahoArgentineanArmenianAssyrian/Chaldean/SyriacAustralianAustrianBahamianBangladeshiBarbadianBasqueBelgianBelizeanBermudanBhutaneseBlackfeetBolivianBrazilianBritishBritish West IndianBulgarianBurmeseCajunCambodianCanadianCape VerdeanCarpatho RusynCelticCentral AmericanCentral American IndianCherokeeCheyenneChickasawChileanChineseChippewaChoctawColombianColvilleComancheCosta RicanCreeCreekCroatianCrowCubanCypriotCzechCzechoslovakianDanishDelawareDominicanDutchDutch West IndianEastern EuropeanEcuadorianEgyptianEnglishEstonianEthiopianEuropeanFijianFilipinoFinnishFrenchFrench American IndianFrench CanadianGermanGerman RussianGhanaianGreekGuamanian/ChamorroGuatemalanGuyaneseHaitianHmongHonduranHopiHoumaHungarianIcelanderIndian (Asian)IndonesianInupiatIranianIraqiIrishIroquoisIsraeliItalianJamaicanJapaneseJordanianKenyanKiowaKoreanLaotianLatvianLebaneseLiberianLithuanianLumbeeLuxembourgerMacedonianMalaysianMalteseMarshalleseMenomineeMexicanMexican American IndianMongolianMoroccanNative HawaiianNavajoNepaleseNew ZealanderNicaraguanNigerianNorthern EuropeanNorwegianOkinawanOsageOttawaPaiutePakistaniPalestinianPanamanianParaguayanPennsylvania GermanPeruvianPimaPolishPortuguesePotawatomiPuebloPuerto RicanPuget Sound SalishRomanianRussianSalvadoranSamoanScandinavianScotch-IrishScottishSeminoleSenegaleseSerbianShoshoneSierra LeoneanSiouxSlavicSlovakSloveneSomaliSouth AfricanSouth AmericanSouth American IndianSoviet UnionSpaniardSpanishSpanish AmericanSpanish American IndianSri LankanSubsaharan AfricanSudaneseSwedishSwissSyrianTaiwaneseThaiTlingit-HaidaTohono O'OdhamTonganTrinidadian and TobagonianTsimshianTurkishU.S. Virgin IslanderUgandanUkrainianUruguayanUteVenezuelanVietnameseWelshWest IndianYakamaYaquiYugoslavianYumanYup'ikZimbabwean
Immigration
NonimmigrantsImmigrantsAfghanistanAfricaAlbaniaArgentinaArmeniaAsiaAustraliaAustriaBahamasBangladeshBarbadosBelarusBelgiumBelizeBoliviaBosnia and HerzegovinaBrazilBulgariaBurma/MyanmarCabo VerdeCambodiaCameroonCanadaCaribbeanCentral AmericaChileChinaColombiaCongoCosta RicaCroatiaCubaCzechoslovakiaDenmarkDominicaDominican RepublicEastern AfricaEastern AsiaEastern EuropeEcuadorEgyptEl SalvadorEnglandEritreaEthiopiaEuropeFijiFranceGermanyGhanaGreeceGrenadaGuatemalaGuyanaHaitiHondurasHong KongHungaryIndiaIndonesiaIranIraqIrelandIsraelItalyJamaicaJapanJordanKazakhstanKenyaKoreaKuwaitLaosLatin AmericaLatviaLebanonLiberiaLithuaniaMalaysiaMexicoMicronesiaMiddle AfricaMoldovaMoroccoNepalNetherlandsNicaraguaNigeriaNorth AmericaNorth MacedoniaNorthern AfricaNorthern EuropeNorwayOceaniaPakistanPanamaPeruPhilippinesPolandPortugalRomaniaRussiaSaudi ArabiaScotlandSenegalSerbiaSierra LeoneSingaporeSomaliaSouth AfricaSouth AmericaSouth Central AsiaSouth Eastern AsiaSouthern EuropeSpainSri LankaSt. Vincent and the GrenadinesSudanSwedenSwitzerlandSyriaTaiwanThailandTrinidad and TobagoTurkeyUgandaUkraineUruguayUzbekistanVenezuelaVietnamWest IndiesWestern AfricaWestern AsiaWestern EuropeYemenZaireZimbabwe
Immigrants from the Azores
Race
Ancestry
AfghanAfricanAlaska NativeAlaskan AthabascanAlbanianAleutAlsatianAmericanApacheArabArapahoArgentineanArmenianAssyrian/Chaldean/SyriacAustralianAustrianBahamianBangladeshiBarbadianBasqueBelgianBelizeanBermudanBhutaneseBlackfeetBolivianBrazilianBritishBritish West IndianBulgarianBurmeseCajunCambodianCanadianCape VerdeanCarpatho RusynCelticCentral AmericanCentral American IndianCherokeeCheyenneChickasawChileanChineseChippewaChoctawColombianColvilleComancheCosta RicanCreeCreekCroatianCrowCubanCypriotCzechCzechoslovakianDanishDelawareDominicanDutchDutch West IndianEastern EuropeanEcuadorianEgyptianEnglishEstonianEthiopianEuropeanFijianFilipinoFinnishFrenchFrench American IndianFrench CanadianGermanGerman RussianGhanaianGreekGuamanian/ChamorroGuatemalanGuyaneseHaitianHmongHonduranHopiHoumaHungarianIcelanderIndian (Asian)IndonesianInupiatIranianIraqiIrishIroquoisIsraeliItalianJamaicanJapaneseJordanianKenyanKiowaKoreanLaotianLatvianLebaneseLiberianLithuanianLumbeeLuxembourgerMacedonianMalaysianMalteseMarshalleseMenomineeMexicanMexican American IndianMongolianMoroccanNative HawaiianNavajoNepaleseNew ZealanderNicaraguanNigerianNorthern EuropeanNorwegianOkinawanOsageOttawaPaiutePakistaniPalestinianPanamanianParaguayanPennsylvania GermanPeruvianPimaPolishPortuguesePotawatomiPuebloPuerto RicanPuget Sound SalishRomanianRussianSalvadoranSamoanScandinavianScotch-IrishScottishSeminoleSenegaleseSerbianShoshoneSierra LeoneanSiouxSlavicSlovakSloveneSomaliSouth AfricanSouth AmericanSouth American IndianSoviet UnionSpaniardSpanishSpanish AmericanSpanish American IndianSri LankanSubsaharan AfricanSudaneseSwedishSwissSyrianTaiwaneseThaiTlingit-HaidaTohono O'OdhamTonganTrinidadian and TobagonianTsimshianTurkishU.S. Virgin IslanderUgandanUkrainianUruguayanUteVenezuelanVietnameseWelshWest IndianYakamaYaquiYugoslavianYumanYup'ikZimbabwean
Immigration
NonimmigrantsImmigrantsAfghanistanAfricaAlbaniaArgentinaArmeniaAsiaAustraliaAustriaBahamasBangladeshBarbadosBelarusBelgiumBelizeBoliviaBosnia and HerzegovinaBrazilBulgariaBurma/MyanmarCabo VerdeCambodiaCameroonCanadaCaribbeanCentral AmericaChileChinaColombiaCongoCosta RicaCroatiaCubaCzechoslovakiaDenmarkDominicaDominican RepublicEastern AfricaEastern AsiaEastern EuropeEcuadorEgyptEl SalvadorEnglandEritreaEthiopiaEuropeFijiFranceGermanyGhanaGreeceGrenadaGuatemalaGuyanaHaitiHondurasHong KongHungaryIndiaIndonesiaIranIraqIrelandIsraelItalyJamaicaJapanJordanKazakhstanKenyaKoreaKuwaitLaosLatin AmericaLatviaLebanonLiberiaLithuaniaMalaysiaMexicoMicronesiaMiddle AfricaMoldovaMoroccoNepalNetherlandsNicaraguaNigeriaNorth AmericaNorth MacedoniaNorthern AfricaNorthern EuropeNorwayOceaniaPakistanPanamaPeruPhilippinesPolandPortugalRomaniaRussiaSaudi ArabiaScotlandSenegalSerbiaSierra LeoneSingaporeSomaliaSouth AmericaSouth Central AsiaSouth Eastern AsiaSouthern EuropeSpainSri LankaSt. Vincent and the GrenadinesSudanSwedenSwitzerlandSyriaTaiwanThailandTrinidad and TobagoTurkeyUgandaUkraineUruguayUzbekistanVenezuelaVietnamWest IndiesWestern AfricaWestern AsiaWestern EuropeYemenZaireZimbabweAzores
Poverty
Income
Poverty
Unemployment
Labor Participation
Family Structure
Vehicle Availability
Education Level
Disability

Poverty Comparison

Immigrants from South Africa

Immigrants from the Azores

Exceptional
Tragic
11.5%
POVERTY
94.7/ 100
METRIC RATING
96th/ 347
METRIC RANK
13.1%
POVERTY
6.1/ 100
METRIC RATING
210th/ 347
METRIC RANK

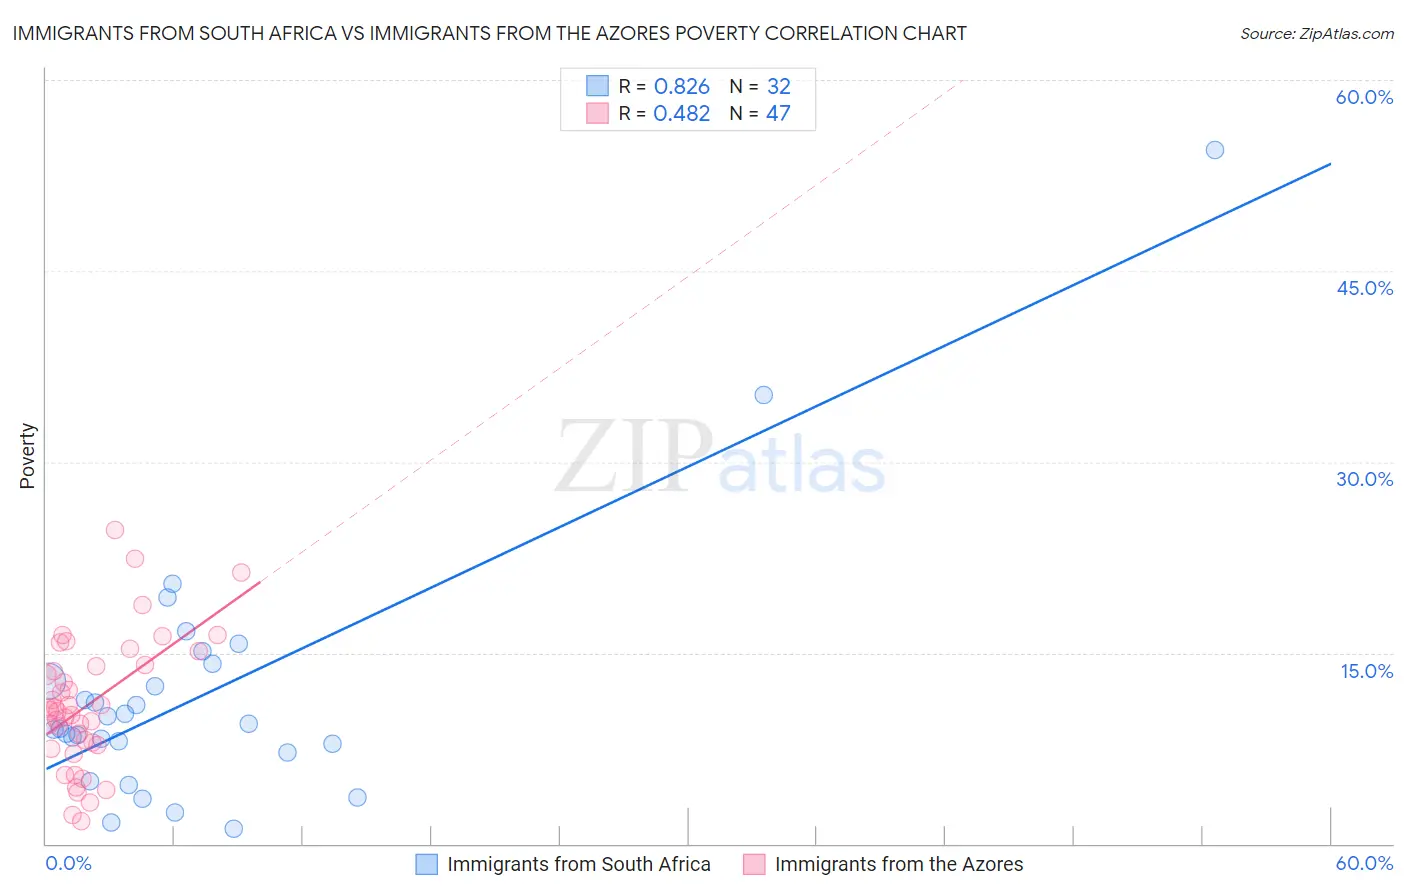
Immigrants from South Africa vs Immigrants from the Azores Poverty Correlation Chart

The statistical analysis conducted on geographies consisting of 233,262,094 people shows a very strong positive correlation between the proportion of Immigrants from South Africa and poverty level in the United States with a correlation coefficient (R) of 0.826 and weighted average of 11.5%. Similarly, the statistical analysis conducted on geographies consisting of 46,256,915 people shows a moderate positive correlation between the proportion of Immigrants from the Azores and poverty level in the United States with a correlation coefficient (R) of 0.482 and weighted average of 13.1%, a difference of 14.6%.
Immigrants from South Africa vs Immigrants from the Azores Poverty

Poverty Correlation Summary

MeasurementImmigrants from South AfricaImmigrants from the Azores
Minimum1.2%1.8%
Maximum54.5%24.6%
Range53.4%22.8%
Mean11.8%11.0%
Median9.3%10.5%
Interquartile 25% (IQ1)7.5%7.8%
Interquartile 75% (IQ3)13.4%14.1%
Interquartile Range (IQR)5.9%6.3%
Standard Deviation (Sample)10.2%5.1%
Standard Deviation (Population)10.0%5.1%

Similar Demographics by Poverty

Demographics Similar to Immigrants from South Africa by Poverty

In terms of poverty, the demographic groups most similar to Immigrants from South Africa are Immigrants from Egypt (11.5%, a difference of 0.030%), Immigrants from Latvia (11.5%, a difference of 0.070%), Paraguayan (11.4%, a difference of 0.12%), Australian (11.4%, a difference of 0.12%), and Romanian (11.4%, a difference of 0.14%).
DemographicsRating | RankPoverty
Czechoslovakians
95.7
/100
|
#89
Exceptional
11.4%
Immigrants | Denmark
95.5
/100
|
#90
Exceptional
11.4%
Finns
95.2
/100
|
#91
Exceptional
11.4%
British
95.0
/100
|
#92
Exceptional
11.4%
Romanians
94.9
/100
|
#93
Exceptional
11.4%
Paraguayans
94.9
/100
|
#94
Exceptional
11.4%
Australians
94.9
/100
|
#95
Exceptional
11.4%
Immigrants | South Africa
94.7
/100
|
#96
Exceptional
11.5%
Immigrants | Egypt
94.6
/100
|
#97
Exceptional
11.5%
Immigrants | Latvia
94.5
/100
|
#98
Exceptional
11.5%
Immigrants | Indonesia
94.2
/100
|
#99
Exceptional
11.5%
Scottish
94.0
/100
|
#100
Exceptional
11.5%
Slavs
93.3
/100
|
#101
Exceptional
11.5%
Laotians
92.4
/100
|
#102
Exceptional
11.6%
Okinawans
92.4
/100
|
#103
Exceptional
11.6%

Demographics Similar to Immigrants from the Azores by Poverty

In terms of poverty, the demographic groups most similar to Immigrants from the Azores are Malaysian (13.1%, a difference of 0.030%), Ugandan (13.1%, a difference of 0.060%), Panamanian (13.1%, a difference of 0.21%), Immigrants from Eastern Africa (13.1%, a difference of 0.34%), and Moroccan (13.2%, a difference of 0.35%).
DemographicsRating | RankPoverty
Hmong
15.0
/100
|
#203
Poor
12.8%
Immigrants | Western Asia
14.1
/100
|
#204
Poor
12.9%
Tsimshian
9.2
/100
|
#205
Tragic
13.0%
Immigrants | Eastern Africa
7.0
/100
|
#206
Tragic
13.1%
Panamanians
6.6
/100
|
#207
Tragic
13.1%
Ugandans
6.2
/100
|
#208
Tragic
13.1%
Malaysians
6.1
/100
|
#209
Tragic
13.1%
Immigrants | Azores
6.1
/100
|
#210
Tragic
13.1%
Moroccans
5.2
/100
|
#211
Tragic
13.2%
Immigrants | Immigrants
4.3
/100
|
#212
Tragic
13.2%
Immigrants | Panama
4.1
/100
|
#213
Tragic
13.3%
Bermudans
3.7
/100
|
#214
Tragic
13.3%
Japanese
3.3
/100
|
#215
Tragic
13.3%
Immigrants | Nonimmigrants
3.3
/100
|
#216
Tragic
13.3%
Immigrants | Uzbekistan
3.2
/100
|
#217
Tragic
13.3%