Immigrants from Somalia vs Paraguayan Child Poverty Under the Age of 16

COMPARE

Immigrants from Somalia
Race
Ancestry
AfghanAfricanAlaska NativeAlaskan AthabascanAlbanianAleutAlsatianAmericanApacheArabArapahoArgentineanArmenianAssyrian/Chaldean/SyriacAustralianAustrianBahamianBangladeshiBarbadianBasqueBelgianBelizeanBermudanBhutaneseBlackfeetBolivianBrazilianBritishBritish West IndianBulgarianBurmeseCajunCambodianCanadianCape VerdeanCarpatho RusynCelticCentral AmericanCentral American IndianCherokeeCheyenneChickasawChileanChineseChippewaChoctawColombianColvilleComancheCosta RicanCreeCreekCroatianCrowCubanCypriotCzechCzechoslovakianDanishDelawareDominicanDutchDutch West IndianEastern EuropeanEcuadorianEgyptianEnglishEstonianEthiopianEuropeanFijianFilipinoFinnishFrenchFrench American IndianFrench CanadianGermanGerman RussianGhanaianGreekGuamanian/ChamorroGuatemalanGuyaneseHaitianHmongHonduranHopiHoumaHungarianIcelanderIndian (Asian)IndonesianInupiatIranianIraqiIrishIroquoisIsraeliItalianJamaicanJapaneseJordanianKenyanKiowaKoreanLaotianLatvianLebaneseLiberianLithuanianLumbeeLuxembourgerMacedonianMalaysianMalteseMarshalleseMenomineeMexicanMexican American IndianMongolianMoroccanNative HawaiianNavajoNepaleseNew ZealanderNicaraguanNigerianNorthern EuropeanNorwegianOkinawanOsageOttawaPaiutePakistaniPalestinianPanamanianPennsylvania GermanPeruvianPimaPolishPortuguesePotawatomiPuebloPuerto RicanPuget Sound SalishRomanianRussianSalvadoranSamoanScandinavianScotch-IrishScottishSeminoleSenegaleseSerbianShoshoneSierra LeoneanSiouxSlavicSlovakSloveneSomaliSouth AfricanSouth AmericanSouth American IndianSoviet UnionSpaniardSpanishSpanish AmericanSpanish American IndianSri LankanSubsaharan AfricanSudaneseSwedishSwissSyrianTaiwaneseThaiTlingit-HaidaTohono O'OdhamTonganTrinidadian and TobagonianTsimshianTurkishU.S. Virgin IslanderUgandanUkrainianUruguayanUteVenezuelanVietnameseWelshWest IndianYakamaYaquiYugoslavianYumanYup'ikZimbabwean
Immigration
NonimmigrantsImmigrantsAfghanistanAfricaAlbaniaArgentinaArmeniaAsiaAustraliaAustriaBahamasBangladeshBarbadosBelarusBelgiumBelizeBoliviaBosnia and HerzegovinaBrazilBulgariaBurma/MyanmarCabo VerdeCambodiaCameroonCanadaCaribbeanCentral AmericaChileChinaColombiaCongoCosta RicaCroatiaCubaCzechoslovakiaDenmarkDominicaDominican RepublicEastern AfricaEastern AsiaEastern EuropeEcuadorEgyptEl SalvadorEnglandEritreaEthiopiaEuropeFijiFranceGermanyGhanaGreeceGrenadaGuatemalaGuyanaHaitiHondurasHong KongHungaryIndiaIndonesiaIranIraqIrelandIsraelItalyJamaicaJapanJordanKazakhstanKenyaKoreaKuwaitLaosLatin AmericaLatviaLebanonLiberiaLithuaniaMalaysiaMexicoMicronesiaMiddle AfricaMoldovaMoroccoNepalNetherlandsNicaraguaNigeriaNorth AmericaNorth MacedoniaNorthern AfricaNorthern EuropeNorwayOceaniaPakistanPanamaPeruPhilippinesPolandPortugalRomaniaRussiaSaudi ArabiaScotlandSenegalSerbiaSierra LeoneSingaporeSomaliaSouth AfricaSouth AmericaSouth Central AsiaSouth Eastern AsiaSouthern EuropeSpainSri LankaSt. Vincent and the GrenadinesSudanSwedenSwitzerlandSyriaTaiwanThailandTrinidad and TobagoTurkeyUgandaUkraineUruguayUzbekistanVenezuelaVietnamWest IndiesWestern AfricaWestern AsiaWestern EuropeYemenZaireZimbabweAzores
Paraguayan
Race
Ancestry
AfghanAfricanAlaska NativeAlaskan AthabascanAlbanianAleutAlsatianAmericanApacheArabArapahoArgentineanArmenianAssyrian/Chaldean/SyriacAustralianAustrianBahamianBangladeshiBarbadianBasqueBelgianBelizeanBermudanBhutaneseBlackfeetBolivianBrazilianBritishBritish West IndianBulgarianBurmeseCajunCambodianCanadianCape VerdeanCarpatho RusynCelticCentral AmericanCentral American IndianCherokeeCheyenneChickasawChileanChineseChippewaChoctawColombianColvilleComancheCosta RicanCreeCreekCroatianCrowCubanCypriotCzechCzechoslovakianDanishDelawareDominicanDutchDutch West IndianEastern EuropeanEcuadorianEgyptianEnglishEstonianEthiopianEuropeanFijianFilipinoFinnishFrenchFrench American IndianFrench CanadianGermanGerman RussianGhanaianGreekGuamanian/ChamorroGuatemalanGuyaneseHaitianHmongHonduranHopiHoumaHungarianIcelanderIndian (Asian)IndonesianInupiatIranianIraqiIrishIroquoisIsraeliItalianJamaicanJapaneseJordanianKenyanKiowaKoreanLaotianLatvianLebaneseLiberianLithuanianLumbeeLuxembourgerMacedonianMalaysianMalteseMarshalleseMenomineeMexicanMexican American IndianMongolianMoroccanNative HawaiianNavajoNepaleseNew ZealanderNicaraguanNigerianNorthern EuropeanNorwegianOkinawanOsageOttawaPaiutePakistaniPalestinianPanamanianParaguayanPennsylvania GermanPeruvianPimaPolishPortuguesePotawatomiPuebloPuerto RicanPuget Sound SalishRomanianRussianSalvadoranSamoanScandinavianScotch-IrishScottishSeminoleSenegaleseSerbianShoshoneSierra LeoneanSiouxSlavicSlovakSloveneSomaliSouth AfricanSouth AmericanSouth American IndianSoviet UnionSpaniardSpanishSpanish AmericanSpanish American IndianSri LankanSubsaharan AfricanSudaneseSwedishSwissSyrianTaiwaneseThaiTlingit-HaidaTohono O'OdhamTonganTrinidadian and TobagonianTsimshianTurkishU.S. Virgin IslanderUgandanUkrainianUruguayanUteVenezuelanVietnameseWelshWest IndianYakamaYaquiYugoslavianYumanYup'ikZimbabwean
Immigration
NonimmigrantsImmigrantsAfghanistanAfricaAlbaniaArgentinaArmeniaAsiaAustraliaAustriaBahamasBangladeshBarbadosBelarusBelgiumBelizeBoliviaBosnia and HerzegovinaBrazilBulgariaBurma/MyanmarCabo VerdeCambodiaCameroonCanadaCaribbeanCentral AmericaChileChinaColombiaCongoCosta RicaCroatiaCubaCzechoslovakiaDenmarkDominicaDominican RepublicEastern AfricaEastern AsiaEastern EuropeEcuadorEgyptEl SalvadorEnglandEritreaEthiopiaEuropeFijiFranceGermanyGhanaGreeceGrenadaGuatemalaGuyanaHaitiHondurasHong KongHungaryIndiaIndonesiaIranIraqIrelandIsraelItalyJamaicaJapanJordanKazakhstanKenyaKoreaKuwaitLaosLatin AmericaLatviaLebanonLiberiaLithuaniaMalaysiaMexicoMicronesiaMiddle AfricaMoldovaMoroccoNepalNetherlandsNicaraguaNigeriaNorth AmericaNorth MacedoniaNorthern AfricaNorthern EuropeNorwayOceaniaPakistanPanamaPeruPhilippinesPolandPortugalRomaniaRussiaSaudi ArabiaScotlandSenegalSerbiaSierra LeoneSingaporeSouth AfricaSouth AmericaSouth Central AsiaSouth Eastern AsiaSouthern EuropeSpainSri LankaSt. Vincent and the GrenadinesSudanSwedenSwitzerlandSyriaTaiwanThailandTrinidad and TobagoTurkeyUgandaUkraineUruguayUzbekistanVenezuelaVietnamWest IndiesWestern AfricaWestern AsiaWestern EuropeYemenZaireZimbabweAzores
Child Poverty Under the Age of 16
Income
Poverty
Unemployment
Labor Participation
Family Structure
Vehicle Availability
Education Level
Disability

Child Poverty Under the Age of 16 Comparison

Immigrants from Somalia

Paraguayans

Tragic
Exceptional
21.6%
CHILD POVERTY UNDER THE AGE OF 16
0.0/ 100
METRIC RATING
314th/ 347
METRIC RANK
14.7%
CHILD POVERTY UNDER THE AGE OF 16
95.7/ 100
METRIC RATING
97th/ 347
METRIC RANK

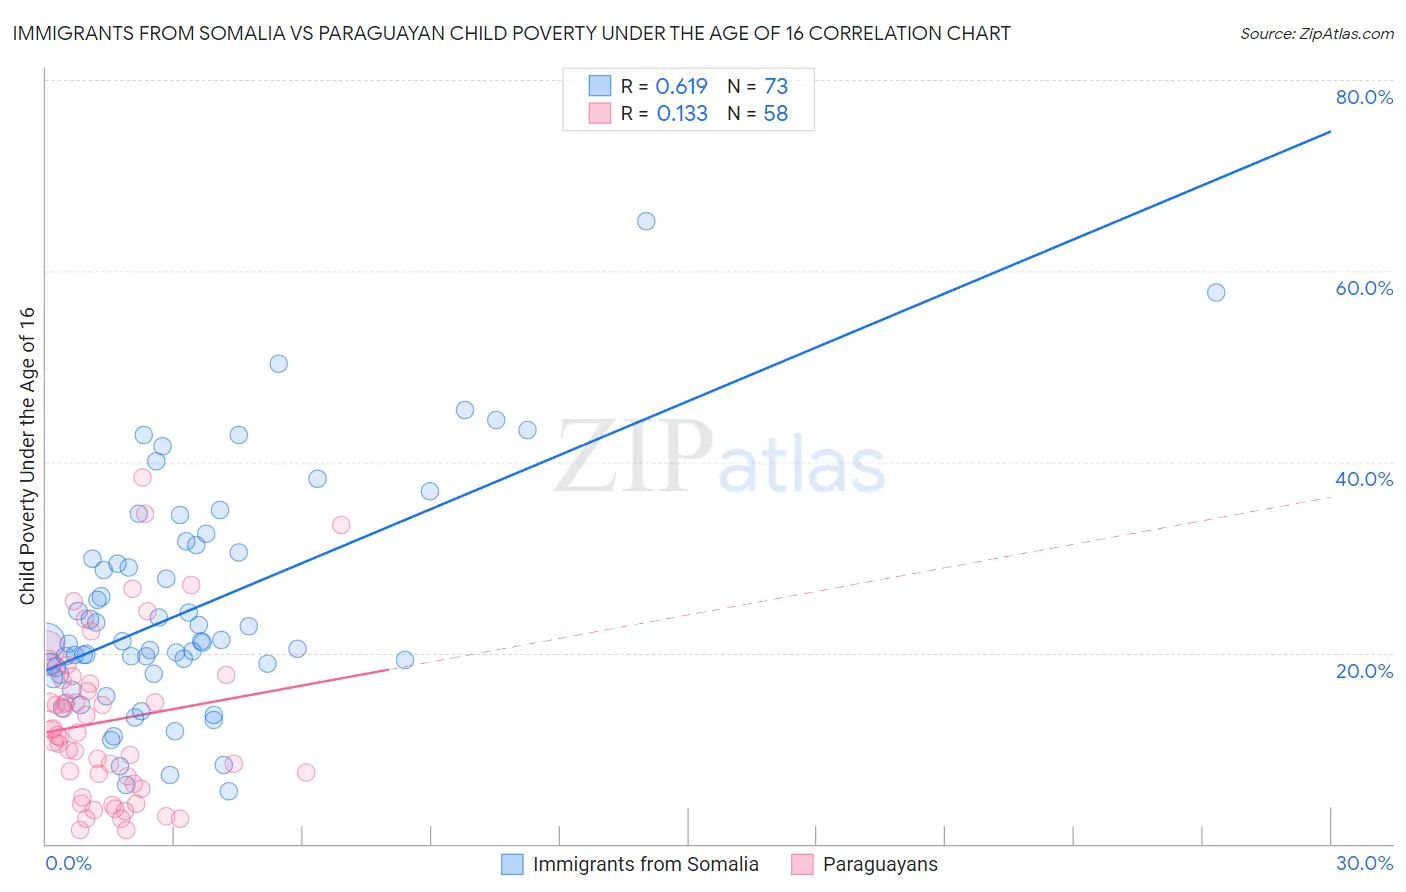
Immigrants from Somalia vs Paraguayan Child Poverty Under the Age of 16 Correlation Chart

The statistical analysis conducted on geographies consisting of 91,982,423 people shows a significant positive correlation between the proportion of Immigrants from Somalia and poverty level among children under the age of 16 in the United States with a correlation coefficient (R) of 0.619 and weighted average of 21.6%. Similarly, the statistical analysis conducted on geographies consisting of 94,860,447 people shows a poor positive correlation between the proportion of Paraguayans and poverty level among children under the age of 16 in the United States with a correlation coefficient (R) of 0.133 and weighted average of 14.7%, a difference of 46.8%.
Immigrants from Somalia vs Paraguayan Child Poverty Under the Age of 16

Child Poverty Under the Age of 16 Correlation Summary

MeasurementImmigrants from SomaliaParaguayan
Minimum5.5%1.4%
Maximum65.2%38.4%
Range59.7%37.0%
Mean24.6%12.9%
Median21.2%11.5%
Interquartile 25% (IQ1)17.8%6.2%
Interquartile 75% (IQ3)30.9%17.1%
Interquartile Range (IQR)13.1%10.9%
Standard Deviation (Sample)11.9%8.6%
Standard Deviation (Population)11.9%8.5%

Similar Demographics by Child Poverty Under the Age of 16

Demographics Similar to Immigrants from Somalia by Child Poverty Under the Age of 16

In terms of child poverty under the age of 16, the demographic groups most similar to Immigrants from Somalia are Immigrants from Guatemala (21.6%, a difference of 0.14%), Creek (21.5%, a difference of 0.21%), Ute (21.5%, a difference of 0.23%), Dutch West Indian (21.5%, a difference of 0.48%), and African (21.7%, a difference of 0.56%).
DemographicsRating | RankChild Poverty Under the Age of 16
Immigrants | Central America
0.0
/100
|
#307
Tragic
21.3%
British West Indians
0.0
/100
|
#308
Tragic
21.3%
Immigrants | Mexico
0.0
/100
|
#309
Tragic
21.5%
Bahamians
0.0
/100
|
#310
Tragic
21.5%
Dutch West Indians
0.0
/100
|
#311
Tragic
21.5%
Ute
0.0
/100
|
#312
Tragic
21.5%
Creek
0.0
/100
|
#313
Tragic
21.5%
Immigrants | Somalia
0.0
/100
|
#314
Tragic
21.6%
Immigrants | Guatemala
0.0
/100
|
#315
Tragic
21.6%
Africans
0.0
/100
|
#316
Tragic
21.7%
Immigrants | Dominica
0.0
/100
|
#317
Tragic
21.9%
U.S. Virgin Islanders
0.0
/100
|
#318
Tragic
22.0%
Yakama
0.0
/100
|
#319
Tragic
22.1%
Cajuns
0.0
/100
|
#320
Tragic
22.1%
Kiowa
0.0
/100
|
#321
Tragic
22.2%

Demographics Similar to Paraguayans by Child Poverty Under the Age of 16

In terms of child poverty under the age of 16, the demographic groups most similar to Paraguayans are Immigrants from Belarus (14.7%, a difference of 0.010%), Immigrants from France (14.7%, a difference of 0.12%), British (14.7%, a difference of 0.13%), Immigrants from Croatia (14.6%, a difference of 0.36%), and Dutch (14.8%, a difference of 0.45%).
DemographicsRating | RankChild Poverty Under the Age of 16
Austrians
96.9
/100
|
#90
Exceptional
14.5%
Immigrants | North America
96.7
/100
|
#91
Exceptional
14.6%
Immigrants | Italy
96.7
/100
|
#92
Exceptional
14.6%
Argentineans
96.6
/100
|
#93
Exceptional
14.6%
Immigrants | South Africa
96.3
/100
|
#94
Exceptional
14.6%
Immigrants | Croatia
96.1
/100
|
#95
Exceptional
14.6%
Immigrants | France
95.8
/100
|
#96
Exceptional
14.7%
Paraguayans
95.7
/100
|
#97
Exceptional
14.7%
Immigrants | Belarus
95.7
/100
|
#98
Exceptional
14.7%
British
95.5
/100
|
#99
Exceptional
14.7%
Dutch
95.1
/100
|
#100
Exceptional
14.8%
Immigrants | Switzerland
95.1
/100
|
#101
Exceptional
14.8%
Romanians
95.0
/100
|
#102
Exceptional
14.8%
Immigrants | Egypt
94.9
/100
|
#103
Exceptional
14.8%
Immigrants | England
94.8
/100
|
#104
Exceptional
14.8%