Immigrants from Sierra Leone vs Sri Lankan Child Poverty Under the Age of 5

COMPARE

Immigrants from Sierra Leone
Race
Ancestry
AfghanAfricanAlaska NativeAlaskan AthabascanAlbanianAleutAlsatianAmericanApacheArabArapahoArgentineanArmenianAssyrian/Chaldean/SyriacAustralianAustrianBahamianBangladeshiBarbadianBasqueBelgianBelizeanBermudanBhutaneseBlackfeetBolivianBrazilianBritishBritish West IndianBulgarianBurmeseCajunCambodianCanadianCape VerdeanCarpatho RusynCelticCentral AmericanCentral American IndianCherokeeCheyenneChickasawChileanChineseChippewaChoctawColombianColvilleComancheCosta RicanCreeCreekCroatianCrowCubanCypriotCzechCzechoslovakianDanishDelawareDominicanDutchDutch West IndianEastern EuropeanEcuadorianEgyptianEnglishEstonianEthiopianEuropeanFijianFilipinoFinnishFrenchFrench American IndianFrench CanadianGermanGerman RussianGhanaianGreekGuamanian/ChamorroGuatemalanGuyaneseHaitianHmongHonduranHopiHoumaHungarianIcelanderIndian (Asian)IndonesianInupiatIranianIraqiIrishIroquoisIsraeliItalianJamaicanJapaneseJordanianKenyanKiowaKoreanLaotianLatvianLebaneseLiberianLithuanianLumbeeLuxembourgerMacedonianMalaysianMalteseMarshalleseMenomineeMexicanMexican American IndianMongolianMoroccanNative HawaiianNavajoNepaleseNew ZealanderNicaraguanNigerianNorthern EuropeanNorwegianOkinawanOsageOttawaPaiutePakistaniPalestinianPanamanianParaguayanPennsylvania GermanPeruvianPimaPolishPortuguesePotawatomiPuebloPuerto RicanPuget Sound SalishRomanianRussianSalvadoranSamoanScandinavianScotch-IrishScottishSeminoleSenegaleseSerbianShoshoneSierra LeoneanSiouxSlavicSlovakSloveneSomaliSouth AfricanSouth AmericanSouth American IndianSoviet UnionSpaniardSpanishSpanish AmericanSpanish American IndianSubsaharan AfricanSudaneseSwedishSwissSyrianTaiwaneseThaiTlingit-HaidaTohono O'OdhamTonganTrinidadian and TobagonianTsimshianTurkishU.S. Virgin IslanderUgandanUkrainianUruguayanUteVenezuelanVietnameseWelshWest IndianYakamaYaquiYugoslavianYumanYup'ikZimbabwean
Immigration
NonimmigrantsImmigrantsAfghanistanAfricaAlbaniaArgentinaArmeniaAsiaAustraliaAustriaBahamasBangladeshBarbadosBelarusBelgiumBelizeBoliviaBosnia and HerzegovinaBrazilBulgariaBurma/MyanmarCabo VerdeCambodiaCameroonCanadaCaribbeanCentral AmericaChileChinaColombiaCongoCosta RicaCroatiaCubaCzechoslovakiaDenmarkDominicaDominican RepublicEastern AfricaEastern AsiaEastern EuropeEcuadorEgyptEl SalvadorEnglandEritreaEthiopiaEuropeFijiFranceGermanyGhanaGreeceGrenadaGuatemalaGuyanaHaitiHondurasHong KongHungaryIndiaIndonesiaIranIraqIrelandIsraelItalyJamaicaJapanJordanKazakhstanKenyaKoreaKuwaitLaosLatin AmericaLatviaLebanonLiberiaLithuaniaMalaysiaMexicoMicronesiaMiddle AfricaMoldovaMoroccoNepalNetherlandsNicaraguaNigeriaNorth AmericaNorth MacedoniaNorthern AfricaNorthern EuropeNorwayOceaniaPakistanPanamaPeruPhilippinesPolandPortugalRomaniaRussiaSaudi ArabiaScotlandSenegalSerbiaSierra LeoneSingaporeSomaliaSouth AfricaSouth AmericaSouth Central AsiaSouth Eastern AsiaSouthern EuropeSpainSri LankaSt. Vincent and the GrenadinesSudanSwedenSwitzerlandSyriaTaiwanThailandTrinidad and TobagoTurkeyUgandaUkraineUruguayUzbekistanVenezuelaVietnamWest IndiesWestern AfricaWestern AsiaWestern EuropeYemenZaireZimbabweAzores
Sri Lankan
Race
Ancestry
AfghanAfricanAlaska NativeAlaskan AthabascanAlbanianAleutAlsatianAmericanApacheArabArapahoArgentineanArmenianAssyrian/Chaldean/SyriacAustralianAustrianBahamianBangladeshiBarbadianBasqueBelgianBelizeanBermudanBhutaneseBlackfeetBolivianBrazilianBritishBritish West IndianBulgarianBurmeseCajunCambodianCanadianCape VerdeanCarpatho RusynCelticCentral AmericanCentral American IndianCherokeeCheyenneChickasawChileanChineseChippewaChoctawColombianColvilleComancheCosta RicanCreeCreekCroatianCrowCubanCypriotCzechCzechoslovakianDanishDelawareDominicanDutchDutch West IndianEastern EuropeanEcuadorianEgyptianEnglishEstonianEthiopianEuropeanFijianFilipinoFinnishFrenchFrench American IndianFrench CanadianGermanGerman RussianGhanaianGreekGuamanian/ChamorroGuatemalanGuyaneseHaitianHmongHonduranHopiHoumaHungarianIcelanderIndian (Asian)IndonesianInupiatIranianIraqiIrishIroquoisIsraeliItalianJamaicanJapaneseJordanianKenyanKiowaKoreanLaotianLatvianLebaneseLiberianLithuanianLumbeeLuxembourgerMacedonianMalaysianMalteseMarshalleseMenomineeMexicanMexican American IndianMongolianMoroccanNative HawaiianNavajoNepaleseNew ZealanderNicaraguanNigerianNorthern EuropeanNorwegianOkinawanOsageOttawaPaiutePakistaniPalestinianPanamanianParaguayanPennsylvania GermanPeruvianPimaPolishPortuguesePotawatomiPuebloPuerto RicanPuget Sound SalishRomanianRussianSalvadoranSamoanScandinavianScotch-IrishScottishSeminoleSenegaleseSerbianShoshoneSierra LeoneanSiouxSlavicSlovakSloveneSomaliSouth AfricanSouth AmericanSouth American IndianSoviet UnionSpaniardSpanishSpanish AmericanSpanish American IndianSri LankanSubsaharan AfricanSudaneseSwedishSwissSyrianTaiwaneseThaiTlingit-HaidaTohono O'OdhamTonganTrinidadian and TobagonianTsimshianTurkishU.S. Virgin IslanderUgandanUkrainianUruguayanUteVenezuelanVietnameseWelshWest IndianYakamaYaquiYugoslavianYumanYup'ikZimbabwean
Immigration
NonimmigrantsImmigrantsAfghanistanAfricaAlbaniaArgentinaArmeniaAsiaAustraliaAustriaBahamasBangladeshBarbadosBelarusBelgiumBelizeBoliviaBosnia and HerzegovinaBrazilBulgariaBurma/MyanmarCabo VerdeCambodiaCameroonCanadaCaribbeanCentral AmericaChileChinaColombiaCongoCosta RicaCroatiaCubaCzechoslovakiaDenmarkDominicaDominican RepublicEastern AfricaEastern AsiaEastern EuropeEcuadorEgyptEl SalvadorEnglandEritreaEthiopiaEuropeFijiFranceGermanyGhanaGreeceGrenadaGuatemalaGuyanaHaitiHondurasHong KongHungaryIndiaIndonesiaIranIraqIrelandIsraelItalyJamaicaJapanJordanKazakhstanKenyaKoreaKuwaitLaosLatin AmericaLatviaLebanonLiberiaLithuaniaMalaysiaMexicoMicronesiaMiddle AfricaMoldovaMoroccoNepalNetherlandsNicaraguaNigeriaNorth AmericaNorth MacedoniaNorthern AfricaNorthern EuropeNorwayOceaniaPakistanPanamaPeruPhilippinesPolandPortugalRomaniaRussiaSaudi ArabiaScotlandSenegalSerbiaSingaporeSomaliaSouth AfricaSouth AmericaSouth Central AsiaSouth Eastern AsiaSouthern EuropeSpainSri LankaSt. Vincent and the GrenadinesSudanSwedenSwitzerlandSyriaTaiwanThailandTrinidad and TobagoTurkeyUgandaUkraineUruguayUzbekistanVenezuelaVietnamWest IndiesWestern AfricaWestern AsiaWestern EuropeYemenZaireZimbabweAzores
Child Poverty Under the Age of 5
Income
Poverty
Unemployment
Labor Participation
Family Structure
Vehicle Availability
Education Level
Disability

Child Poverty Under the Age of 5 Comparison

Immigrants from Sierra Leone

Sri Lankans

Average
Exceptional
17.3%
CHILD POVERTY UNDER THE AGE OF 5
43.6/ 100
METRIC RATING
177th/ 347
METRIC RANK
15.5%
CHILD POVERTY UNDER THE AGE OF 5
98.1/ 100
METRIC RATING
78th/ 347
METRIC RANK

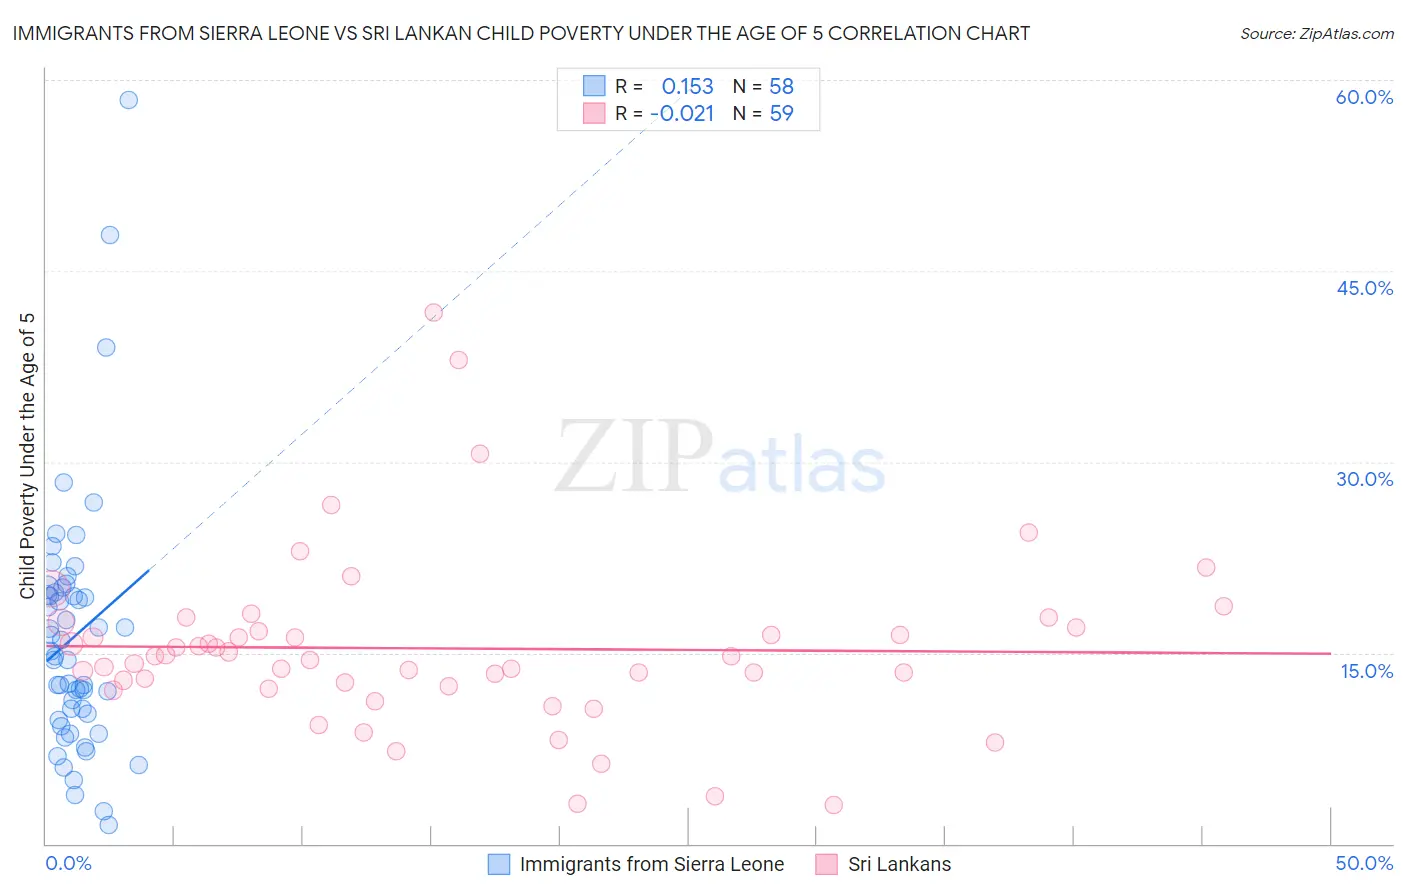
Immigrants from Sierra Leone vs Sri Lankan Child Poverty Under the Age of 5 Correlation Chart

The statistical analysis conducted on geographies consisting of 100,756,435 people shows a poor positive correlation between the proportion of Immigrants from Sierra Leone and poverty level among children under the age of 5 in the United States with a correlation coefficient (R) of 0.153 and weighted average of 17.3%. Similarly, the statistical analysis conducted on geographies consisting of 422,664,150 people shows no correlation between the proportion of Sri Lankans and poverty level among children under the age of 5 in the United States with a correlation coefficient (R) of -0.021 and weighted average of 15.5%, a difference of 12.2%.
Immigrants from Sierra Leone vs Sri Lankan Child Poverty Under the Age of 5

Child Poverty Under the Age of 5 Correlation Summary

MeasurementImmigrants from Sierra LeoneSri Lankan
Minimum1.5%3.1%
Maximum58.4%41.7%
Range57.0%38.7%
Mean16.3%15.3%
Median14.9%14.7%
Interquartile 25% (IQ1)10.2%12.4%
Interquartile 75% (IQ3)19.7%17.0%
Interquartile Range (IQR)9.5%4.6%
Standard Deviation (Sample)9.9%6.9%
Standard Deviation (Population)9.8%6.8%

Similar Demographics by Child Poverty Under the Age of 5

Demographics Similar to Immigrants from Sierra Leone by Child Poverty Under the Age of 5

In terms of child poverty under the age of 5, the demographic groups most similar to Immigrants from Sierra Leone are Immigrants from Cameroon (17.4%, a difference of 0.10%), Immigrants from Iraq (17.3%, a difference of 0.16%), Hawaiian (17.4%, a difference of 0.23%), South American Indian (17.4%, a difference of 0.23%), and Immigrants from Germany (17.4%, a difference of 0.28%).
DemographicsRating | RankChild Poverty Under the Age of 5
Immigrants | Western Asia
59.2
/100
|
#170
Average
17.1%
Immigrants | Morocco
58.9
/100
|
#171
Average
17.1%
Yugoslavians
54.1
/100
|
#172
Average
17.2%
Welsh
54.0
/100
|
#173
Average
17.2%
Immigrants | Saudi Arabia
50.0
/100
|
#174
Average
17.2%
Immigrants | Lebanon
47.6
/100
|
#175
Average
17.3%
Immigrants | Iraq
45.2
/100
|
#176
Average
17.3%
Immigrants | Sierra Leone
43.6
/100
|
#177
Average
17.3%
Immigrants | Cameroon
42.7
/100
|
#178
Average
17.4%
Hawaiians
41.5
/100
|
#179
Average
17.4%
South American Indians
41.4
/100
|
#180
Average
17.4%
Immigrants | Germany
41.0
/100
|
#181
Average
17.4%
Arabs
40.7
/100
|
#182
Average
17.4%
Lebanese
40.3
/100
|
#183
Average
17.4%
Immigrants | Costa Rica
39.0
/100
|
#184
Fair
17.4%

Demographics Similar to Sri Lankans by Child Poverty Under the Age of 5

In terms of child poverty under the age of 5, the demographic groups most similar to Sri Lankans are Australian (15.5%, a difference of 0.25%), Immigrants from Turkey (15.4%, a difference of 0.33%), Italian (15.5%, a difference of 0.37%), Czech (15.5%, a difference of 0.48%), and Immigrants from Argentina (15.4%, a difference of 0.54%).
DemographicsRating | RankChild Poverty Under the Age of 5
Immigrants | Egypt
98.8
/100
|
#71
Exceptional
15.3%
Immigrants | Sweden
98.8
/100
|
#72
Exceptional
15.3%
Immigrants | Ukraine
98.7
/100
|
#73
Exceptional
15.3%
Argentineans
98.5
/100
|
#74
Exceptional
15.4%
Immigrants | Argentina
98.5
/100
|
#75
Exceptional
15.4%
Croatians
98.5
/100
|
#76
Exceptional
15.4%
Immigrants | Turkey
98.3
/100
|
#77
Exceptional
15.4%
Sri Lankans
98.1
/100
|
#78
Exceptional
15.5%
Australians
98.0
/100
|
#79
Exceptional
15.5%
Italians
97.9
/100
|
#80
Exceptional
15.5%
Czechs
97.8
/100
|
#81
Exceptional
15.5%
Immigrants | Italy
97.7
/100
|
#82
Exceptional
15.6%
Chileans
97.6
/100
|
#83
Exceptional
15.6%
Immigrants | Netherlands
97.6
/100
|
#84
Exceptional
15.6%
Immigrants | Latvia
97.4
/100
|
#85
Exceptional
15.6%