Immigrants from Senegal vs Immigrants from the Azores Child Poverty Under the Age of 5

COMPARE

Immigrants from Senegal
Race
Ancestry
AfghanAfricanAlaska NativeAlaskan AthabascanAlbanianAleutAlsatianAmericanApacheArabArapahoArgentineanArmenianAssyrian/Chaldean/SyriacAustralianAustrianBahamianBangladeshiBarbadianBasqueBelgianBelizeanBermudanBhutaneseBlackfeetBolivianBrazilianBritishBritish West IndianBulgarianBurmeseCajunCambodianCanadianCape VerdeanCarpatho RusynCelticCentral AmericanCentral American IndianCherokeeCheyenneChickasawChileanChineseChippewaChoctawColombianColvilleComancheCosta RicanCreeCreekCroatianCrowCubanCypriotCzechCzechoslovakianDanishDelawareDominicanDutchDutch West IndianEastern EuropeanEcuadorianEgyptianEnglishEstonianEthiopianEuropeanFijianFilipinoFinnishFrenchFrench American IndianFrench CanadianGermanGerman RussianGhanaianGreekGuamanian/ChamorroGuatemalanGuyaneseHaitianHmongHonduranHopiHoumaHungarianIcelanderIndian (Asian)IndonesianInupiatIranianIraqiIrishIroquoisIsraeliItalianJamaicanJapaneseJordanianKenyanKiowaKoreanLaotianLatvianLebaneseLiberianLithuanianLumbeeLuxembourgerMacedonianMalaysianMalteseMarshalleseMenomineeMexicanMexican American IndianMongolianMoroccanNative HawaiianNavajoNepaleseNew ZealanderNicaraguanNigerianNorthern EuropeanNorwegianOkinawanOsageOttawaPaiutePakistaniPalestinianPanamanianParaguayanPennsylvania GermanPeruvianPimaPolishPortuguesePotawatomiPuebloPuerto RicanPuget Sound SalishRomanianRussianSalvadoranSamoanScandinavianScotch-IrishScottishSeminoleSenegaleseSerbianShoshoneSierra LeoneanSiouxSlavicSlovakSloveneSomaliSouth AfricanSouth AmericanSouth American IndianSoviet UnionSpaniardSpanishSpanish AmericanSpanish American IndianSri LankanSubsaharan AfricanSudaneseSwedishSwissSyrianTaiwaneseThaiTlingit-HaidaTohono O'OdhamTonganTrinidadian and TobagonianTsimshianTurkishU.S. Virgin IslanderUgandanUkrainianUruguayanUteVenezuelanVietnameseWelshWest IndianYakamaYaquiYugoslavianYumanYup'ikZimbabwean
Immigration
NonimmigrantsImmigrantsAfghanistanAfricaAlbaniaArgentinaArmeniaAsiaAustraliaAustriaBahamasBangladeshBarbadosBelarusBelgiumBelizeBoliviaBosnia and HerzegovinaBrazilBulgariaBurma/MyanmarCabo VerdeCambodiaCameroonCanadaCaribbeanCentral AmericaChileChinaColombiaCongoCosta RicaCroatiaCubaCzechoslovakiaDenmarkDominicaDominican RepublicEastern AfricaEastern AsiaEastern EuropeEcuadorEgyptEl SalvadorEnglandEritreaEthiopiaEuropeFijiFranceGermanyGhanaGreeceGrenadaGuatemalaGuyanaHaitiHondurasHong KongHungaryIndiaIndonesiaIranIraqIrelandIsraelItalyJamaicaJapanJordanKazakhstanKenyaKoreaKuwaitLaosLatin AmericaLatviaLebanonLiberiaLithuaniaMalaysiaMexicoMicronesiaMiddle AfricaMoldovaMoroccoNepalNetherlandsNicaraguaNigeriaNorth AmericaNorth MacedoniaNorthern AfricaNorthern EuropeNorwayOceaniaPakistanPanamaPeruPhilippinesPolandPortugalRomaniaRussiaSaudi ArabiaScotlandSenegalSerbiaSierra LeoneSingaporeSomaliaSouth AfricaSouth AmericaSouth Central AsiaSouth Eastern AsiaSouthern EuropeSpainSri LankaSt. Vincent and the GrenadinesSudanSwedenSwitzerlandSyriaTaiwanThailandTrinidad and TobagoTurkeyUgandaUkraineUruguayUzbekistanVenezuelaVietnamWest IndiesWestern AfricaWestern AsiaWestern EuropeYemenZaireZimbabwe
Immigrants from the Azores
Race
Ancestry
AfghanAfricanAlaska NativeAlaskan AthabascanAlbanianAleutAlsatianAmericanApacheArabArapahoArgentineanArmenianAssyrian/Chaldean/SyriacAustralianAustrianBahamianBangladeshiBarbadianBasqueBelgianBelizeanBermudanBhutaneseBlackfeetBolivianBrazilianBritishBritish West IndianBulgarianBurmeseCajunCambodianCanadianCape VerdeanCarpatho RusynCelticCentral AmericanCentral American IndianCherokeeCheyenneChickasawChileanChineseChippewaChoctawColombianColvilleComancheCosta RicanCreeCreekCroatianCrowCubanCypriotCzechCzechoslovakianDanishDelawareDominicanDutchDutch West IndianEastern EuropeanEcuadorianEgyptianEnglishEstonianEthiopianEuropeanFijianFilipinoFinnishFrenchFrench American IndianFrench CanadianGermanGerman RussianGhanaianGreekGuamanian/ChamorroGuatemalanGuyaneseHaitianHmongHonduranHopiHoumaHungarianIcelanderIndian (Asian)IndonesianInupiatIranianIraqiIrishIroquoisIsraeliItalianJamaicanJapaneseJordanianKenyanKiowaKoreanLaotianLatvianLebaneseLiberianLithuanianLumbeeLuxembourgerMacedonianMalaysianMalteseMarshalleseMenomineeMexicanMexican American IndianMongolianMoroccanNative HawaiianNavajoNepaleseNew ZealanderNicaraguanNigerianNorthern EuropeanNorwegianOkinawanOsageOttawaPaiutePakistaniPalestinianPanamanianParaguayanPennsylvania GermanPeruvianPimaPolishPortuguesePotawatomiPuebloPuerto RicanPuget Sound SalishRomanianRussianSalvadoranSamoanScandinavianScotch-IrishScottishSeminoleSenegaleseSerbianShoshoneSierra LeoneanSiouxSlavicSlovakSloveneSomaliSouth AfricanSouth AmericanSouth American IndianSoviet UnionSpaniardSpanishSpanish AmericanSpanish American IndianSri LankanSubsaharan AfricanSudaneseSwedishSwissSyrianTaiwaneseThaiTlingit-HaidaTohono O'OdhamTonganTrinidadian and TobagonianTsimshianTurkishU.S. Virgin IslanderUgandanUkrainianUruguayanUteVenezuelanVietnameseWelshWest IndianYakamaYaquiYugoslavianYumanYup'ikZimbabwean
Immigration
NonimmigrantsImmigrantsAfghanistanAfricaAlbaniaArgentinaArmeniaAsiaAustraliaAustriaBahamasBangladeshBarbadosBelarusBelgiumBelizeBoliviaBosnia and HerzegovinaBrazilBulgariaBurma/MyanmarCabo VerdeCambodiaCameroonCanadaCaribbeanCentral AmericaChileChinaColombiaCongoCosta RicaCroatiaCubaCzechoslovakiaDenmarkDominicaDominican RepublicEastern AfricaEastern AsiaEastern EuropeEcuadorEgyptEl SalvadorEnglandEritreaEthiopiaEuropeFijiFranceGermanyGhanaGreeceGrenadaGuatemalaGuyanaHaitiHondurasHong KongHungaryIndiaIndonesiaIranIraqIrelandIsraelItalyJamaicaJapanJordanKazakhstanKenyaKoreaKuwaitLaosLatin AmericaLatviaLebanonLiberiaLithuaniaMalaysiaMexicoMicronesiaMiddle AfricaMoldovaMoroccoNepalNetherlandsNicaraguaNigeriaNorth AmericaNorth MacedoniaNorthern AfricaNorthern EuropeNorwayOceaniaPakistanPanamaPeruPhilippinesPolandPortugalRomaniaRussiaSaudi ArabiaScotlandSerbiaSierra LeoneSingaporeSomaliaSouth AfricaSouth AmericaSouth Central AsiaSouth Eastern AsiaSouthern EuropeSpainSri LankaSt. Vincent and the GrenadinesSudanSwedenSwitzerlandSyriaTaiwanThailandTrinidad and TobagoTurkeyUgandaUkraineUruguayUzbekistanVenezuelaVietnamWest IndiesWestern AfricaWestern AsiaWestern EuropeYemenZaireZimbabweAzores
Child Poverty Under the Age of 5
Income
Poverty
Unemployment
Labor Participation
Family Structure
Vehicle Availability
Education Level
Disability

Child Poverty Under the Age of 5 Comparison

Immigrants from Senegal

Immigrants from the Azores

Tragic
Tragic
21.3%
CHILD POVERTY UNDER THE AGE OF 5
0.0/ 100
METRIC RATING
288th/ 347
METRIC RANK
18.9%
CHILD POVERTY UNDER THE AGE OF 5
2.6/ 100
METRIC RATING
220th/ 347
METRIC RANK

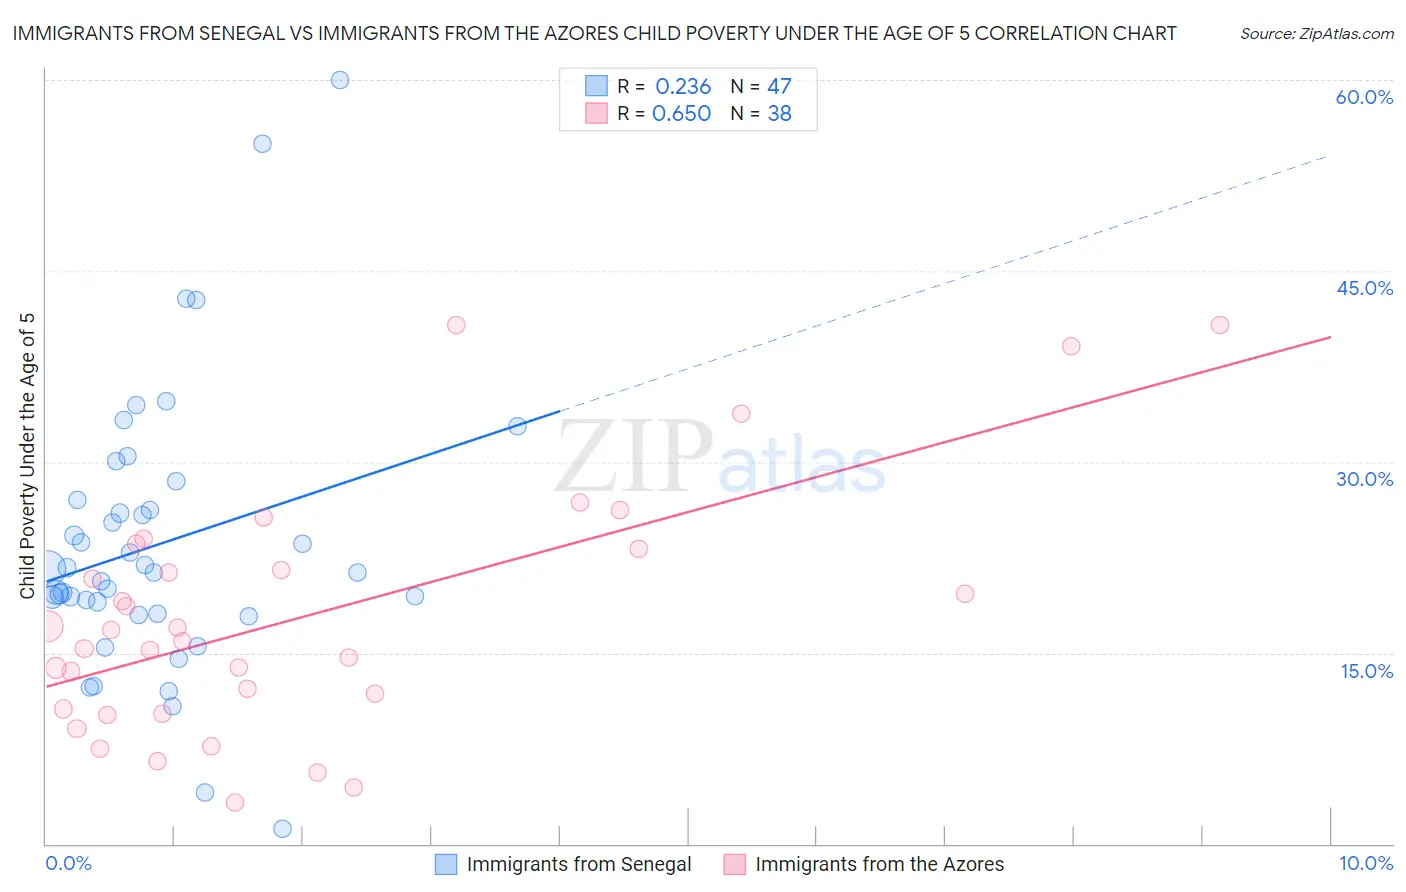
Immigrants from Senegal vs Immigrants from the Azores Child Poverty Under the Age of 5 Correlation Chart

The statistical analysis conducted on geographies consisting of 89,495,365 people shows a weak positive correlation between the proportion of Immigrants from Senegal and poverty level among children under the age of 5 in the United States with a correlation coefficient (R) of 0.236 and weighted average of 21.3%. Similarly, the statistical analysis conducted on geographies consisting of 45,317,352 people shows a significant positive correlation between the proportion of Immigrants from the Azores and poverty level among children under the age of 5 in the United States with a correlation coefficient (R) of 0.650 and weighted average of 18.9%, a difference of 12.9%.
Immigrants from Senegal vs Immigrants from the Azores Child Poverty Under the Age of 5

Child Poverty Under the Age of 5 Correlation Summary

MeasurementImmigrants from SenegalImmigrants from the Azores
Minimum1.2%3.3%
Maximum60.0%40.8%
Range58.8%37.5%
Mean23.5%17.8%
Median21.4%16.4%
Interquartile 25% (IQ1)18.1%10.6%
Interquartile 75% (IQ3)27.0%23.2%
Interquartile Range (IQR)8.9%12.6%
Standard Deviation (Sample)11.0%9.6%
Standard Deviation (Population)10.9%9.4%

Similar Demographics by Child Poverty Under the Age of 5

Demographics Similar to Immigrants from Senegal by Child Poverty Under the Age of 5

In terms of child poverty under the age of 5, the demographic groups most similar to Immigrants from Senegal are Immigrants from Haiti (21.3%, a difference of 0.070%), Immigrants from Zaire (21.3%, a difference of 0.17%), Immigrants from Latin America (21.2%, a difference of 0.27%), Haitian (21.2%, a difference of 0.34%), and Immigrants from Caribbean (21.4%, a difference of 0.48%).
DemographicsRating | RankChild Poverty Under the Age of 5
Senegalese
0.0
/100
|
#281
Tragic
20.9%
Potawatomi
0.0
/100
|
#282
Tragic
21.0%
Comanche
0.0
/100
|
#283
Tragic
21.0%
Somalis
0.0
/100
|
#284
Tragic
21.1%
Haitians
0.0
/100
|
#285
Tragic
21.2%
Immigrants | Latin America
0.0
/100
|
#286
Tragic
21.2%
Immigrants | Zaire
0.0
/100
|
#287
Tragic
21.3%
Immigrants | Senegal
0.0
/100
|
#288
Tragic
21.3%
Immigrants | Haiti
0.0
/100
|
#289
Tragic
21.3%
Immigrants | Caribbean
0.0
/100
|
#290
Tragic
21.4%
British West Indians
0.0
/100
|
#291
Tragic
21.4%
Immigrants | Somalia
0.0
/100
|
#292
Tragic
21.6%
Mexicans
0.0
/100
|
#293
Tragic
21.6%
Guatemalans
0.0
/100
|
#294
Tragic
21.6%
Cherokee
0.0
/100
|
#295
Tragic
21.7%

Demographics Similar to Immigrants from the Azores by Child Poverty Under the Age of 5

In terms of child poverty under the age of 5, the demographic groups most similar to Immigrants from the Azores are German Russian (18.8%, a difference of 0.36%), Immigrants from Nigeria (19.0%, a difference of 0.56%), Delaware (18.7%, a difference of 0.67%), Alsatian (19.1%, a difference of 1.1%), and Cuban (19.1%, a difference of 1.1%).
DemographicsRating | RankChild Poverty Under the Age of 5
Immigrants | Thailand
8.6
/100
|
#213
Tragic
18.3%
Malaysians
6.5
/100
|
#214
Tragic
18.4%
Immigrants | Panama
6.0
/100
|
#215
Tragic
18.5%
Hmong
5.0
/100
|
#216
Tragic
18.5%
Immigrants | Africa
4.6
/100
|
#217
Tragic
18.6%
Delaware
3.4
/100
|
#218
Tragic
18.7%
German Russians
3.0
/100
|
#219
Tragic
18.8%
Immigrants | Azores
2.6
/100
|
#220
Tragic
18.9%
Immigrants | Nigeria
2.1
/100
|
#221
Tragic
19.0%
Alsatians
1.7
/100
|
#222
Tragic
19.1%
Cubans
1.7
/100
|
#223
Tragic
19.1%
Nicaraguans
1.6
/100
|
#224
Tragic
19.1%
Nigerians
1.6
/100
|
#225
Tragic
19.1%
Immigrants | Eritrea
1.5
/100
|
#226
Tragic
19.1%
Cape Verdeans
1.4
/100
|
#227
Tragic
19.1%